

Stochastic is one of the most popular and reliable oscillators, which is a group of technical analysis indicators that help traders determine the momentum of a price. Oscillators are part of momentum indicators, and the two terms are often used interchangeably to refer to technical indicators that monitor the acceleration of a price. While Stochastic has initially been used in traditional markets, such as stock, forex, and commodity trading, it has been successfully applied by cryptocurrency traders as well.
The oscillator was developed by securities trader George Lane in the 1950s. As he put it, “If you visualize a rocket going up in the air – before it can turn down, it must slow down. Momentum always changes direction before price.”
In this way, the indicator is meant to anticipate a potential price reversal before it happens, based on the analysis of momentum alone.
What Is Stochastic and How Does it Work?
Stochastic compares the latest close price to the previous trading range over a given period of time. It’s different from other indicators in the sense that it doesn’t monitor price or volume, but the speed and momentum of trends. Any change in momentum can anticipate either a reversal or the formation of a new trend. Thus, Stochastic is one of the few leading indicators, which are technical tools that help traders predict the price movements before they materialize. Elsewhere, lagging indicators, such as moving averages, reflect the price fluctuations that already happened. However, that doesn’t mean leading indicators are better than the lagging ones – each of them has its purpose.
What Stochastic basically shows is the position of the close price in relation to the price range of a given certain period. The range includes all the prices that the cryptocurrency touched during the analyzed period and is defined by the two extremes. For example, if Bitcoin opened at $50,000, dropped to $49,000, then surged to $54,000, and eventually closed at $52,000, then the range would be between $49,000 (the low) and $54,000 (the high). The correlation between the close price and the range changes constantly, and it defines momentum, which is often referred to as the acceleration of the price. When momentum changes, it helps traders determine a change in the strength of a trend.
For instance, as prices move up, the closes of the analyzed period are likely to be found in the upper portion of the price range. Nevertheless, just before hitting the absolute high, the price doesn’t have as much push as it did, and the closes may no longer be found in the upper portion of the range. Thus, Stochastic starts to drop during or before the final high. Lane’s example with the flying rocket is really the best way to visualize it.
The Stochastic oscillator is displayed below the main chart and shows two lines that are both moving from two extremes: 0 and 100.
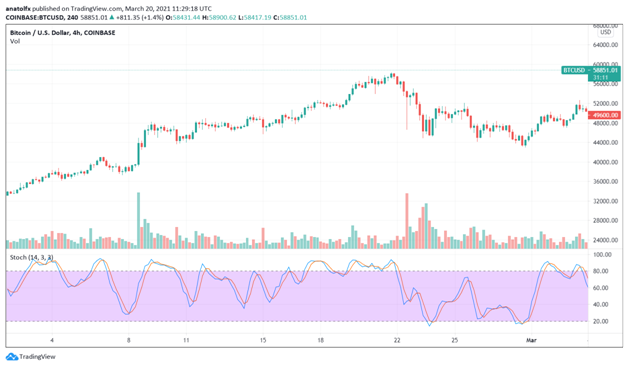

Traders usually pay attention when the indicator is above 80 or below 20, which are defined as the overbought and oversold levels. However, there is much confusion about this – we’ll discuss it a bit later.
Calculating the Stochastic
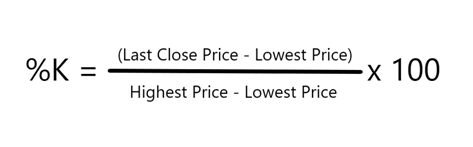
As mentioned, the Stochastic indicator has two lines, which are %K and %D. The former is the Stochastic itself, while %D is the signal line. Here is the formula of Stochastic or the %K line:

Usually, the indicator comes with 14 periods as default, meaning that the lowest and highest price points from the formula refer to the last 14 periods, which can be M1, M30, H1, D1, etc.
Thus, the other way to put the formula is this:
%K = 100* (C – L14) / (H14 – L14)
The second line, %D, is simply a 3-period moving average of the %K line itself and is often called the signal line. In other contexts, %K is called the fast Stochastic, while %D is referred to as the slow one.
On TradinView, the %K line is blue while the %D line is red.
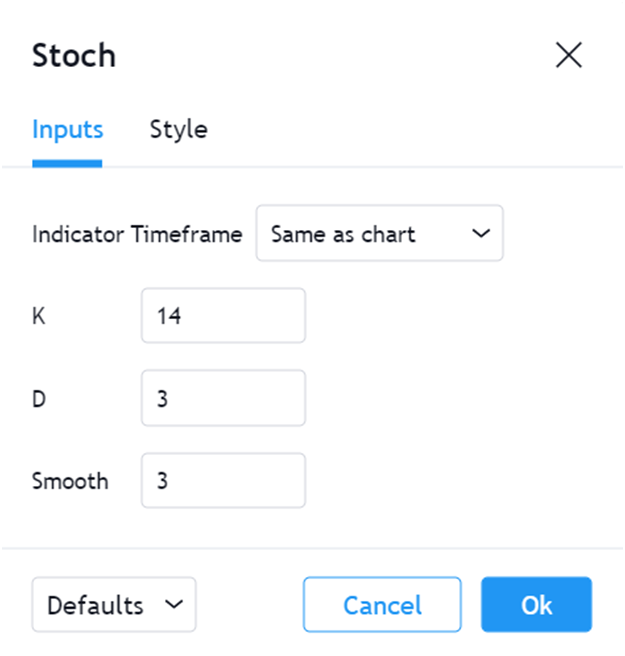
Picking the Right Settings
As mentioned, Stochastic uses the 14 periods by default (which was meant to reflect data for the last 2 weeks), but you can change it depending on your trading style and profile. You can also change the period of the %D line. Note that the higher the period of the signal line, the more it will lag behind %K.
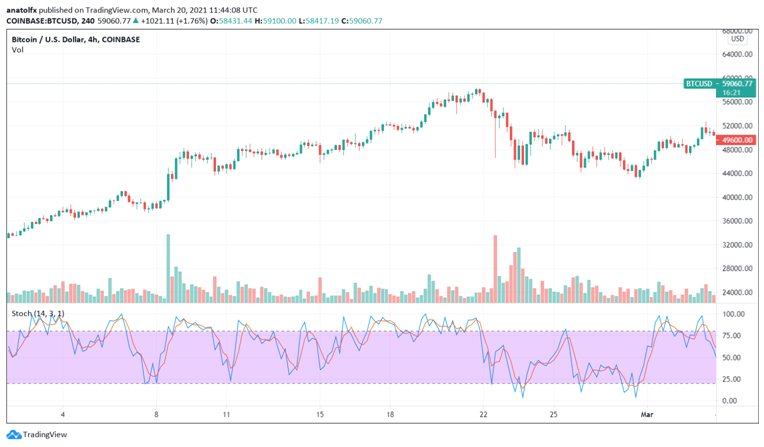
On most charts, including TradingView, you can change the smooth factor, which is usually at 3 by default.

The smoothing of data is needed to avoid unnecessary noises. Without it (when you set the value at 1), the indicator would look like this:

What Does Stochastic Tell You?
While Stochastic doesn’t look as sophisticated as Ichimoku Cloud, for example, it can tell you a lot of things about the price action. Here are some conclusions that you can make based on the indicator’s behavior:
- When the Stochastic oscillator is above 80, it suggests that the cryptocurrency’s price closed near the peak of the 14-period range. Conversely, when the indicator is below 20, it shows that the price closed near the lowest low of the 14-period range. This can give you hints about the potential overbought and oversold levels, but we’re just about to discuss more on that.
- As a rule, in a bullish market, prices will tend to close near the high. On the other end, in a bearish market, prices will close near the low. If the closing price is slipping away from the extreme high or low, it means that the momentum of the existing trend is slowing.
- A reading above 50 suggests that the cryptocurrency is trading within the upper portion of the price range. Readings below 50 indicate that the cryptocurrency is trading in the lower portion of the 14-period range.
Finally, we have to discuss about the confusion related to the Stochastic indicator’s capability to accurately define the overbought and oversold levels. For those unfamiliar, the market is overbought when it has been bullish for a while and the asset ends up overpriced. As a rule, when the market is overbought, traders expect a bearish move to correct the price. The vice versa is true about the oversold condition.
While many reputable sites and trading blogs still affirm that Stochastic identifies overbought and oversold levels, it actually doesn’t. It simply shows the momentum of a price, though it’s true that it may indirectly hint at the overbought and oversold market conditions. What you will hear is that the price is overbought when the %K line is above 80 and oversold when %K is below 20. What’s even worse is that traders who affirm this claim that the market is just about to turn bearish when Stochastic is above 80, which is not necessarily true.
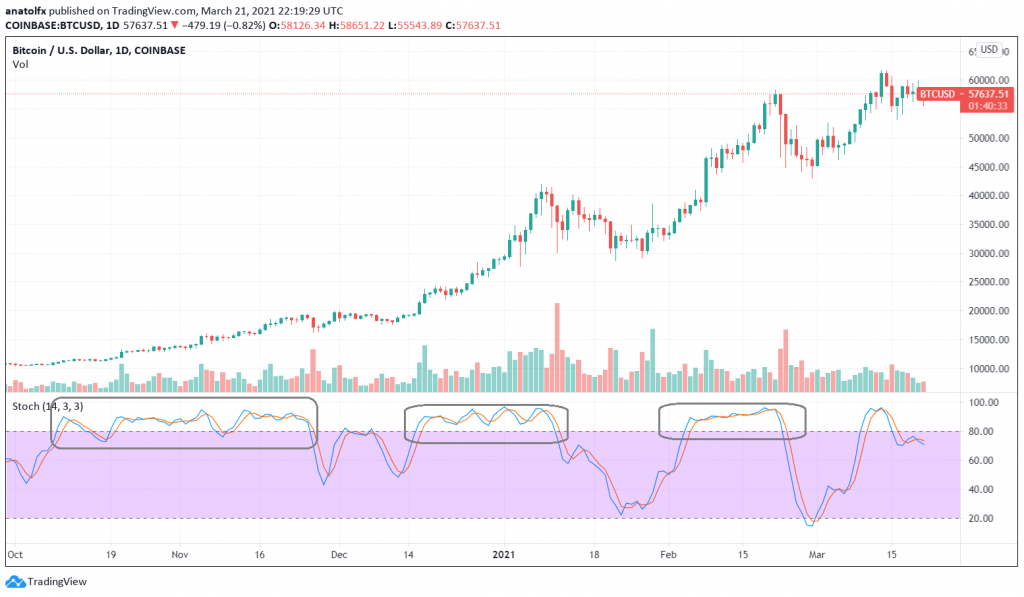
When the Stochastic oscillator is above 80, it actually means that the uptrend is strong. Remember? The close price is in the upper portion of the range. Since the price is still able to close near the top, it means that the uptrend keeps continuing. In fact, Stochastic can stay above 80 for a long time, which defies the recommendation that you should be ready for a bearish market as soon as the indicator reaches the 80 line. This is something you should keep in mind when trading with Stochastic.

How to Use Stochastic in Cryptocurrency Trading?
The Stochastic oscillator can provide several types of signals that you can convert into profitable trades. However, it’s worth mentioning that cryptocurrencies are highly volatile and might often defy the logic of technical analysis, especially on smaller timeframes. To avoid false signals, you can merge Stochastic with other indicators to aim for confluence.
That being said, here are the most common signals and approaches to use the Stochastic:
- Trend following – if Stochastic is moving in one particular direction with the same pace or angle, it suggests that the trend is still valid and ongoing. Thus, you can implement your trend-following strategy and go long if Stochastic points upward or go short if the indicator is declining. When Stochastic is in the overbought/oversold area, don’t rush to exit the market but rather hold on to your trades until it doesn’t leave that zone.
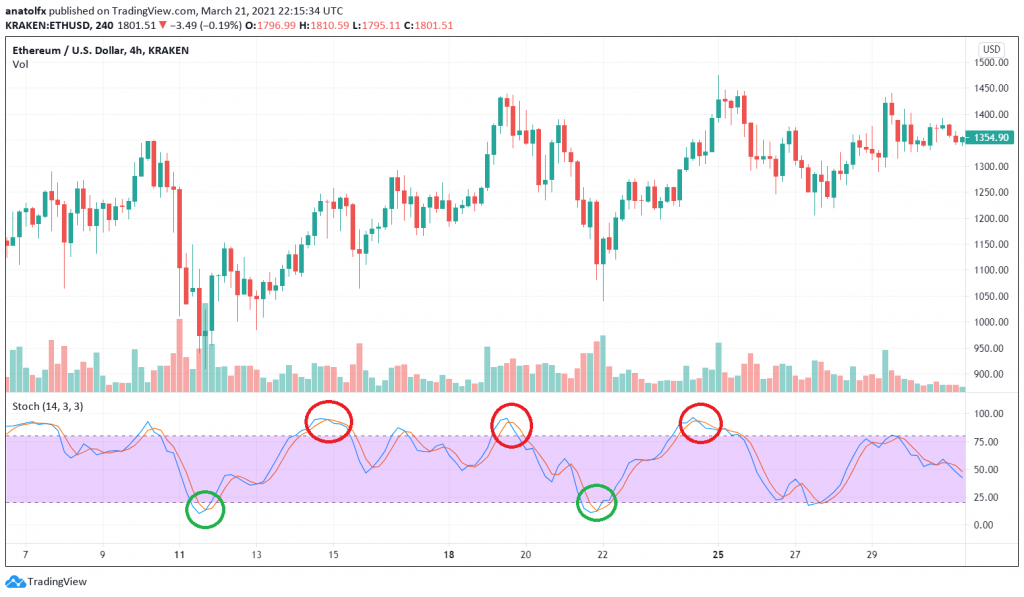
- Trend reversal – when the Stochastic indicator starts to change the direction and leaves the overbought/oversold zone, it anticipates a trend reversal. Thus, if it changes direction and crosses the 80 level from top to bottom, you can go short, and vice versa.
To get an even more accurate signal for your trend reversal strategy, you should wait for the intersection of the two lines. Thus, when the %K line is declining in the overbought zone and crosses below the %D line, you should open a short position. If the Stochastic is increasing and crosses above the %D line in the oversold zone or right on the 20 level, you should go long.
- Breakout trading – Stochastic can be used even for breakout strategies. When you notice that the indicator is suddenly accelerating into one particular direction and the two lines are widening, then it can suggest the beginning of a new trend. This signal is even more relevant if you can confirm that the price is breaking above a resistance or below a support line.
- Divergences – as a momentum indicator, Stochastic is also used to detect divergences. For example, the same is true about the Relative Strength Index (RSI) and MACD. Divergences can suggest trend reversals or the end of the existing trend.
A divergence situation can be confirmed when the price and the indicator move in different directions. Thus, when the bearish trend hits a lower low but the Stochastic indicator displays a higher low, it means that bears lose their dominance, and an uptrend might be on the horizon. In a similar fashion, if the bullish trend forms a higher high but the oscillator shows a lower high, it’s probably time to exit long positions or go short.
Pros and Cons of Stochastic
As with any technical indicator, Stochastic has its advantages and drawbacks.
Starting with the good news, the oscillator is regarded as a leading indicator, meaning that it can actually anticipate the next price movement. Still, the market may not necessarily comply with Stochastic’s logic, as the factors influencing the price are constantly changing.
Another great thing about Stochastic is that it produces clear trading signals quite often. Also, it has been around for decades and thus has been tested in many contexts.
Nevertheless, one of the main drawbacks is that the oscillator produces many false signals, and this factor alone can generate reluctance. To address this issue, you can wait for the trading signals to be in line with the general trend. For this, you may use a slow moving average (MA), such as MA 100 or MA 200. When the price is moving above the MA, consider only the bullish signals provided by Stochastic.
Stochastic vs. the RSI
Stochastic and the Relative Strength Index are often compared because they both are momentum oscillators and have been used for decades. While traders use either one or the other given their similarities, the two indicators have different backgrounds and calculations.
The theory of the Stochastic oscillator is that the closing prices have to close near the same direction as the existing trend. Otherwise, the momentum is losing strength.
Meanwhile, the RSI monitors the overbought and oversold levels by calculating the velocity of price movements. While the RSI also uses 14 periods as the default setting, it measures the relationship between the average high and average low. The RSI also moves within a range between 0 and 100, but the overbought and oversold levels are considered at 70 and 30, respectively. You can see that both indicators look similar, though there are some significant differences:
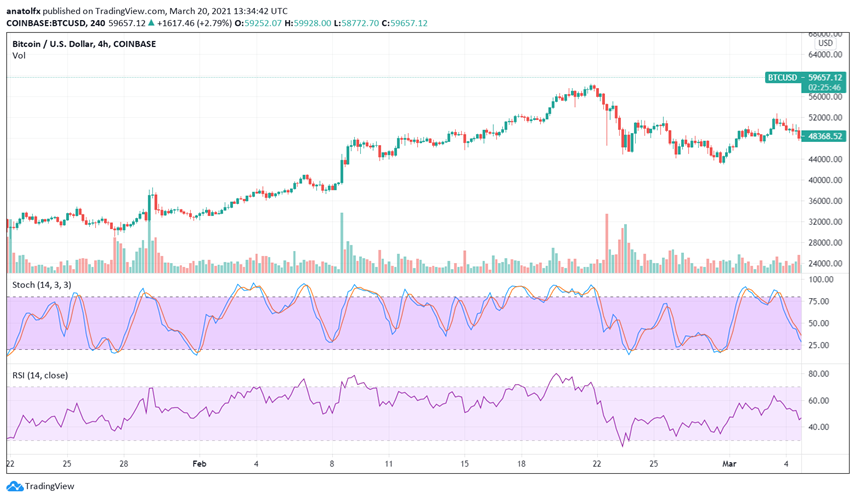

As a rule, it makes sense to use the RSI in trending markets and rely on Stochastic during sideways trends or choppy markets.
The Final Note
Stochastic is one of the most popular technical indicators because it provides meaningful insights on price data. It can be used both by novice and seasons traders.
Cryptocurrency traders have borrowed it from traditional markets and have successfully implemented it, especially in swing trading.
Before trading Stochastic, it’s best to test your abilities on a demo account.