
The Relative Strength Index (RSI) is one of the most popular technical analysis indicators out there. The main function of the RSI is to help traders understand whether the market is overbought or oversold. This is what a momentum indicator mainly does. Thus, you will find the indicator under the “oscillators” category, which may also include Stochastic and MACD, though the latter goes beyond the scope of an oscillator, as you can read in one of my previous articles
The RSI was created by J. Welles Wilder Jr., who introduced it more than four decades ago in his book, “New Concepts in Technical Trading Systems.” Wilder is a very interesting figure. He started as a mechanical engineer and then turned into a real estate developer. Eventually, he focused on technical analysis and invented several indicators that are very popular today. Besides the RSI, Wilder also created the Average True Range, Average Directional Index, and the Parabolic SAR, which is preferred by many beginners. That book containing all the mentioned indicators was really groundbreaking, as it changed technical analysis forever.
As you might guess, the RSI was first developed for traditional markets, like stocks and commodities. Nevertheless, cryptocurrency traders don’t mind using it since it demonstrates the same efficiency in all markets. In fact, crypto traders apply all technical indicators used in traditional markets with the same success, as the market psychology is basically the same.
How Does the RSI Work?
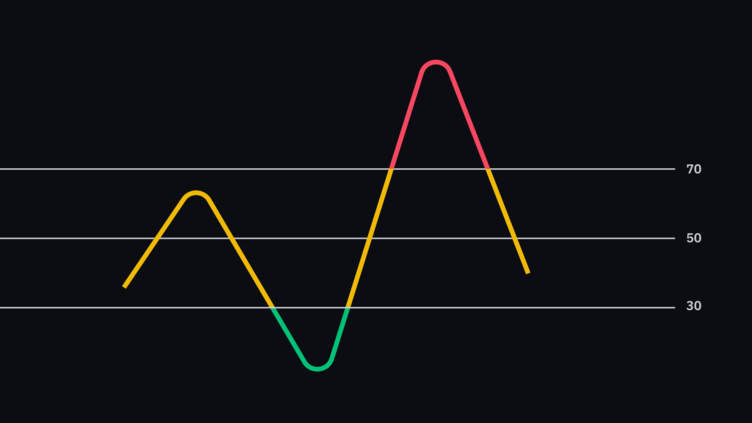
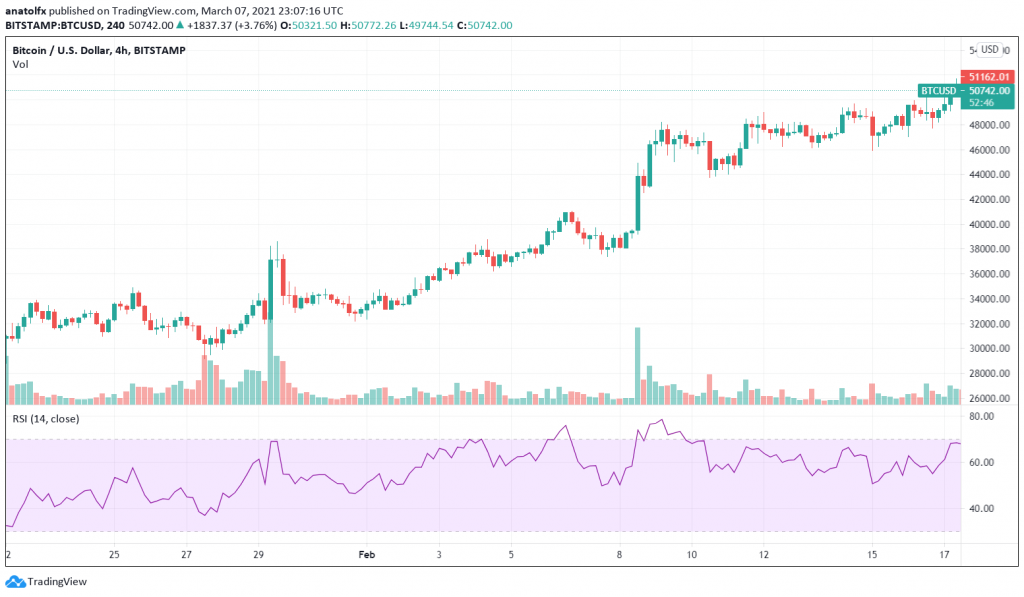
The RSI is a momentum oscillator and represents a line graph that fluctuates within a channel whose extremes are 0 and 100. The indicator is usually displayed under the main chart and looks like this:

The RSI is used to visualize the magnitude of cryptocurrency price changes as well as the speed (or velocity) or price movements. You can use the indicator either independently or in combination with other tools, such as trend-following indicators.
Calculating the RSI
By default, the indicator covers the latest price changes over 14 periods, such as 14 days or 14 hours, depending on the used timeframe. The RSI employs a mathematical formula in which the average price gain over a given period is divided by the average loss. The result is a figure that can range between 0 and 100.
Though the RSI’s formula is not overly complicated, it still requires some in-depth explanation. To learn more about it, you can check Wilder’s book online. Here one version of the formula:
RSI = 100 – [100 / (1 + (Average of Upward Price Change/Average of Downward Price Change))]
Anyway, what you should understand is that the RSI visualizes the difference between upward and downward price changes over a certain period. The resulted figure shown on the indicator’s chart goes up as the number and size of bullish closes increase, and it declines as the number and size of losses accumulate.
As a momentum indicator, the RSI provides crypto traders with insights about the rate at which the price had changed during a given period. Thus, when RSI increases in a bullish market, it demonstrates that the asset is being actively bought. In contrast, if momentum is declining during a bear market, it suggests that traders are dumping the asset.
As mentioned, the main function of the oscillator is to determine the overbought and oversold level of a market. When the RSI is fluctuating above 70, it suggests the cryptocurrency price is in the overbought territory. If the indicator’s figure is below 30, it indicates that the cryptocurrency is oversold. So what does this tell you? In short, when the cryptocurrency is overbought, you may expect a bearish trend reversal soon, as the bull dominance is about to fade out. The logic behind this is that any given asset cannot keep on moving in the same direction forever. The market represents an ongoing conflict between bulls (buyers) and bears (sellers). If the cryptocurrency has rallied for a while, a pullback is normally expected.
Setting Up the RSI Indicator
The RSI is quite straightforward, and it can’t be customized in many ways. On the chart provided by TradingView, which is offered by most crypto exchanges, you can change the period, the source for price data (such as close, open, high, low, and more), and the timeframe.
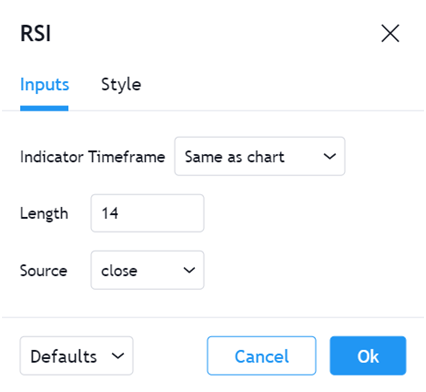

By decreasing the length (setting fewer periods), you can make the RSI more sensitive. For instance, a 10-period RSI will react to the latest price movements more evidently than the one that monitors 25 periods.
The TradingView chart allows you to change the overbought and oversold lines as well. By the way, if you are a short-term trader, you may modify the two lines from 70 and 30 to 80 and 20, respectively. In this way, you will get better signals for your trading style.
How to Use RSI for Crypto Trading
While the RSI has a quite specific job, it still can be used in several different ways. We’ll explore the three most popular approaches to leverage the indicator in your strategies:
Overbought and Oversold Levels
I’ve already made you familiar with the two terms, but we have to focus more on them. I explained that an uptrend or a downtrend can’t go on forever – they will find a strong resistance or support at some point. In other words, the overbought and oversold levels refer to the price of a cryptocurrency in relation to its assumed fair value.
The RSI helps traders determine the two levels as it visualizes the strength of a trend, i.e., it shows how intensely the bulls are buying or how intensely the bears are selling. Overbought and oversold levels are important because they provide decent trading signals to Buy or Sell an asset.
For example, when the price of Bitcoin or an altcoin is fluctuating within the overbought zone, it suggests that there has been substantial bullish momentum for the last few periods. The bullish stance triggers a temporary FOMO (fear of missing out), driving the prices higher than the assumed fair value. Once the pressure from sellers increases and the overvaluation is evident, the uptrend faces resistance, after which it corrects by declining to find its fair value.
Elsewhere, traders consider that a cryptocurrency is oversold when it has been trading below its fair price for a certain period. When that happens, traders expect a bullish reversal, as the price is bottoming out.
The price can rally towards the overbought zone or slump to the oversold market conditions because of investors overreacting to the news or the orders placed by whales. It is no secret that the crypto community is quite active on social media networks, such as Twitter, Telegram or Reddit, which may amplify the crowd behavior. Recently, a Reddit group pumped the price of Dogecoin in a similar way as they did with the stock price of GameStop and other companies dumped by some old-school hedge funds.
Back to the RSI, it is probably the best indicator, along with Stochastic, to identify the overbought and oversold levels. When the RSI line breaks above the overbought line at 70, traders are ready to go short, and vice versa. They would usually enter the market when the RSI line is exiting the respective threshold.
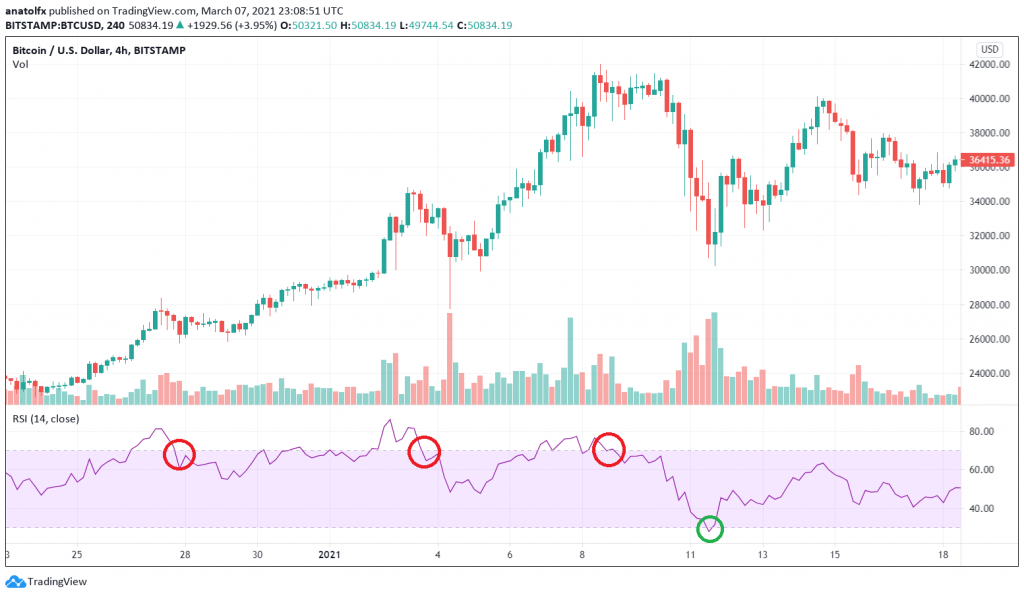
However, this is the most basic approach. Using the RSI like this can give you many false signals, which is why you should use stop losses.
Using the RSI to Spot Divergences
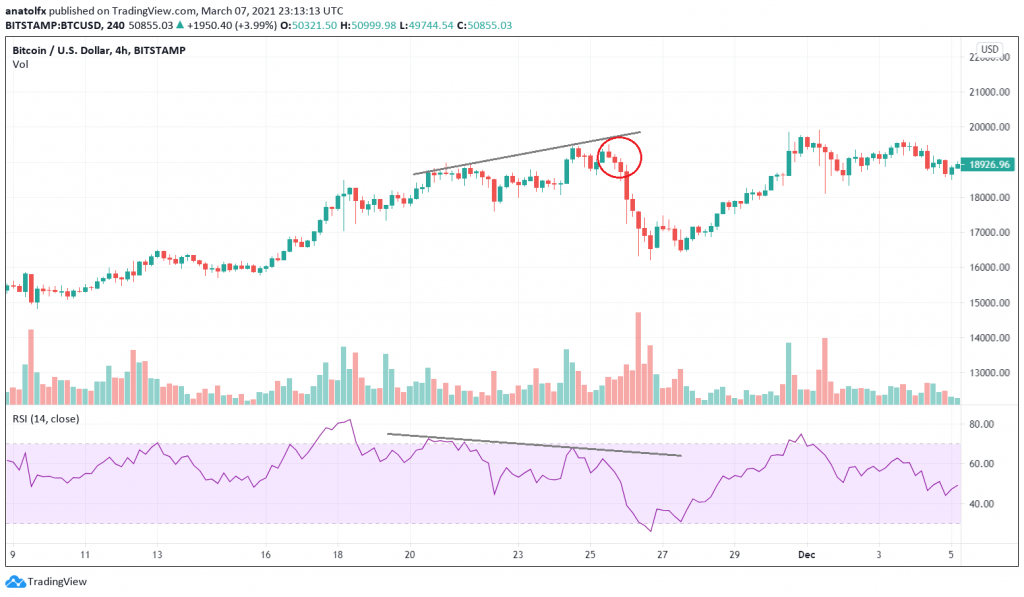
Another approach to use the RSI is to look for divergences between the price action and the indicator itself. Thus, you can anticipate trend reversals or identify resistance and support levels based on divergences alone, whether bullish or bearish.
A bullish divergence occurs when the crypto price declines, generating lower lows, while the RSI score increases, generating higher highs. This suggests that the bearish market is bottoming out and that bulls are becoming stronger. The demand for the digital coin is accumulating despite the bearish move, which anticipates a trend reversal that will push prices higher.
On the contrary, bearish divergences show up during bullish markets, and they indicate that the bullish momentum is losing strength, creating the conditions for a reversal of the uptrend. In this case, the RSI score is declining, displaying lower highs, while the price is increasing, generating higher highs. The price can either pull back for a while or end up in a longer-term downtrend.
It’s worth mentioning that RSI divergences are more relevant during less volatile markets or horizontal channels. When the crypto price is rallying or crashing rapidly, it’s not recommended to rely on divergences. For instance, a strong rally can generate many bearish divergences before the reversal starts. All in all, you should enter the market after three consecutive candles in the direction of your intended trade or at least after a single candle with a long body.
Crossover of Centerline
The two most popular approaches to use the indicator are to determine overbought/oversold levels and look for divergences. Still, some traders prefer to search for bullish or bearish signals when the RSI crosses the center line.
For instance, when the indicator is crossing the center line (50) from bottom to top, it naturally implies a bullish trend. Traders would be interested in going long when the RSI is getting closer to the overbought zone after breaking above the center line. This suggests the uptrend is gaining momentum and might continue for a while.
In a similar fashion, when the RSI crosses the center line from top to bottom, it suggests a declining price. You can go short when the indicator is getting closer to the oversold level shortly after breaking below the center line.
Pros and Cons of RSI
The RSI is popular because it’s quite easy to understand and very efficient at determining the overbought and oversold levels. The indicator can show when a trend is gaining or losing momentum with a high degree of accuracy. Traders prefer the RSI because it can work well in sideways trends.
Still, despite its advantages, the RSI can provide many false signals, especially during trending markets.
Another drawback is that the RSI doesn’t take into account volume during key reversal levels. Thus, you can keep an eye on the volume indicator to assess how relevant any potential reversal is.
RSI vs. Stochastic and MACD
Stochastic is another popular oscillator, and it looks quite similar to the RSI. However, the formulas behind the two indicators are quite different. Specifically, the RSI is calculating the average upward changes versus average losses over “n” periods. Elsewhere, the Stochastic is calculating the close price relative to the “n” period’s highest high and lowest low.
The signals provided by the RSI and Stochastic are frequently very similar, though not always the same. Some traders prefer to merge the two and wait for overlapping signals for extra confirmation before going long or short.
Also, in the case of the RSI, overbought and oversold signals are considered at 70 and 30, respectively, while in Stochastic, an overbought and oversold reading are considered at 80 and 20, respectively.
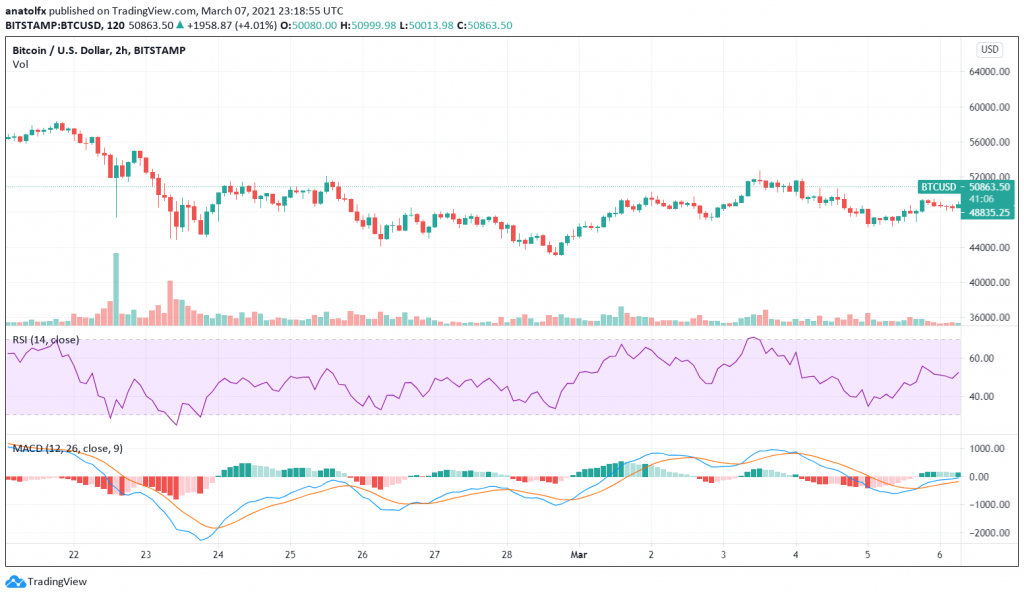
As for MACD, it doesn’t share as many similar aspects as Stochastic. Note that MACD is both a trend-following and momentum indicator. It reflects the relationship between two exponential moving averages (EMAs). The RSI and the MACD are similar because they both can be used to spot divergences with the price action.
The Final Note
While the RSI can provide decent signals to enter long or short positions, you should treat it as a technical indicator that can help you analyze the market in the first place. By accumulating more insights about the market conditions, your decision-making will visibly improve.
To sum up, here are the main characteristics of the RSI:
- The RSI is a momentum indicator (oscillator);
- Traders use it to determine overbought and oversold market conditions;
- The RSI can provide signals based on bullish or bearish divergences with the price action;
- The RSI works better in ranging markets;
- The RSI is quite similar to the Stochastic oscillator.