

What do the financial markets and nature have in common? Well, probably many things, but Fibonacci is the first word that comes to mind of most technical analysts. In the present article, we’ll discuss who Fibonacci was and what it is, though not necessarily in that order.
Fibonacci Retracement is one of the most popular technical analysis tools, though many traders still don’t use it because they don’t really understand how it works. You will also hear about Fibonacci retracements, Fibonacci retracement levels, or simply Fibonacci levels.
What is Fibonacci Retracement?
In a nutshell, Fibonacci retracement levels are horizontal lines plotted on the chart, usually between a swing high and a swing low. These lines can give you hints about where the support and resistance levels might be. In other words, they show where the price is likely to pull back. Each level of the Fibonacci indicator is associated with a percentage, which derives from the so-called Fibonacci sequence.
The Fibonacci retracement levels are 23.6%, 38.2%, 61.8%, 78.6% and 100%. Note that 50% is also used, though this doesn’t derive from the Fibonacci ratio.
The indicator is quite helpful because many strategies rely on determining the resistance and support levels, which may indicate a potential trend reversal. Whether you like to trade within horizontal channels or during trending markets, identifying support and resistance levels is imperative.
Here is what the indicator looks like on TradingView, which is integrated by many cryptocurrency exchanges:
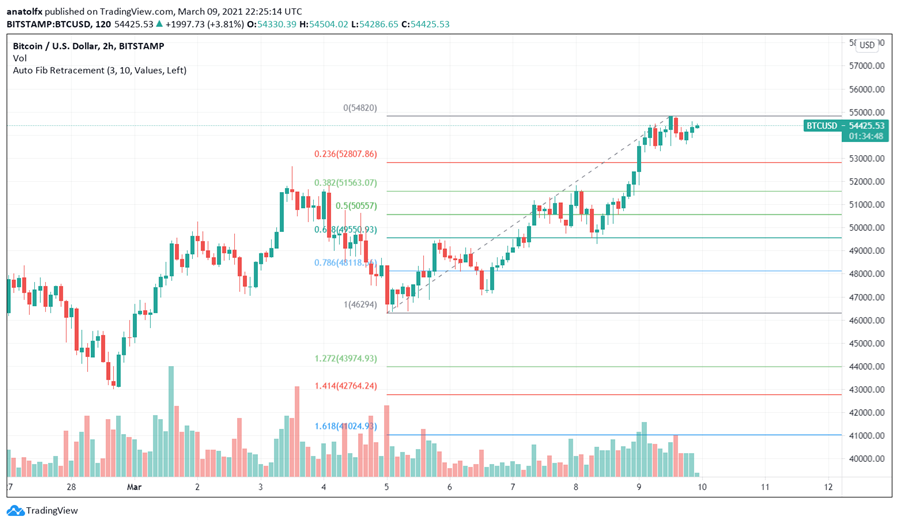

On TradingView, you can find the built-in tool under the name “Auto Fib Retracement.” The great thing about it is that it automatically identifies two relevant price points to create a range for the retracement lines. This is very helpful for beginners who don’t know how to attach the indicator.
Here are the main aspects you should know about the indicator:
- Fibonacci retracements can be used to connect any two points on the chart. Usually, traders connect a high and a low.
- As mentioned, the most common ratios are 23.6%, 38.2%, 50%, 61.8%, and 78.6%.
- The percentage levels describe the approximate level on the chart where the price could pull back.
- Note that the levels do not guarantee that the price will reverse at a certain point! Often, traders merge Fibonacci retracements with other indicators, such as Oscillators or Elliot Waves.
What Are the Fibonacci Sequence and Ratio?
In mathematics, the Fibonacci sequence is a list of numbers in which any given number is the sum of the two preceding ones. Well… except for the first two numbers. For example, if we start with 0, then the sequence will be like this: 0, 1, 1, 2, 3, 5, 8, 13, 21, 34, 55, 89, 144, 233, 377, 610, 987, 1597, 2584, 4181, 6765, 10946, 17711, 28657, 46368, 75025, 121393, 196418, 317811, and…our heads then explode.
The sequence is strongly related to the so-called golden ratio, also known as the divine proportion, which the ancient Greeks called Phi. The golden ratio figure is 1.6180.
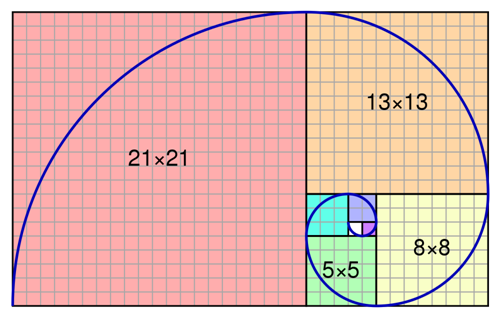

https://en.wikipedia.org/wiki/Golden_spiral#/media/File:FibonacciSpiral.svg
The Fibonacci sequence is named after Italian mathematician Leonardo of Pisa, nicknamed Fibonacci. He lived in the 13th century and introduced these numbers to European mathematics through his 1202 book called Liber Abaci. However, the sequence was first described much earlier in Indian mathematics.
Interestingly, the sequence and the golden ratio can be observed very often in nature, and they have many applications. For example, they can show up in many biological settings, including branching in trees, the flowering of an artichoke, sunflowers, and the arrangement of leaves on a stem or the bracts on a pine cone.


In finance, the Fibonacci ratios are derived from the sequence that we shared above. The ratios are formed by the mathematical relationships found in the sequence’s formula. Thus, we get the following ratios: 23.6%, 38.2%, 61.8%, 78.6%, 100%, 161.8%, 261.8%, and 423.6%. The Fibonacci retracement indicator uses the ratios up to 100% and adds 50% as an additional reference.
Anyway, it’s important to know that the retracement levels do not have any formulas, and they can be applied on the chart between any two points. If you choose a high and a low on the chart, the lines are traced at percentages of that distance.
For example, let’s say that Bitcoin increases from $100,000 to $150,000 (yes – welcome to the future!), and we use these two price points to draw the retracement levels. In this case, the 23.6% level will be at $138,200 – it’s because $150,000 – ($50,000*0.236) = $138,200. Obviously, the 50% level will be at $125,000, and so on. Basically, each percentage applies to the distance between the two points.
How to Use Fibonacci Retracement in Crypto Trading?
The Fibonacci Retracement tool has been used in traditional financial markets for many years, and cryptocurrency traders borrowed the indicator to assess the potential support and resistance levels for the price of Bitcoin and altcoins.
So how can you use it? Let’s see the main approaches both in bullish and bearish markets.
Fibonacci in Uptrend
As you know, the tool can be used to draw between any two significant price points, which are typically a swing high and low. The resulted lines would then help you to anticipate the support and resistance levels.
So, in an uptrend, the low point would be 1 (or 100%), while the peak would be 0%. So here is what you should do:
- Determine an uptrend;
- Add the Fibonacci retracement tool on the chart at the bottom and drag it to the right side, all the way to the peak;
- Check the tree potential support levels at 0.236, 0.382, and 0.618. Note that 50% can also be considered.
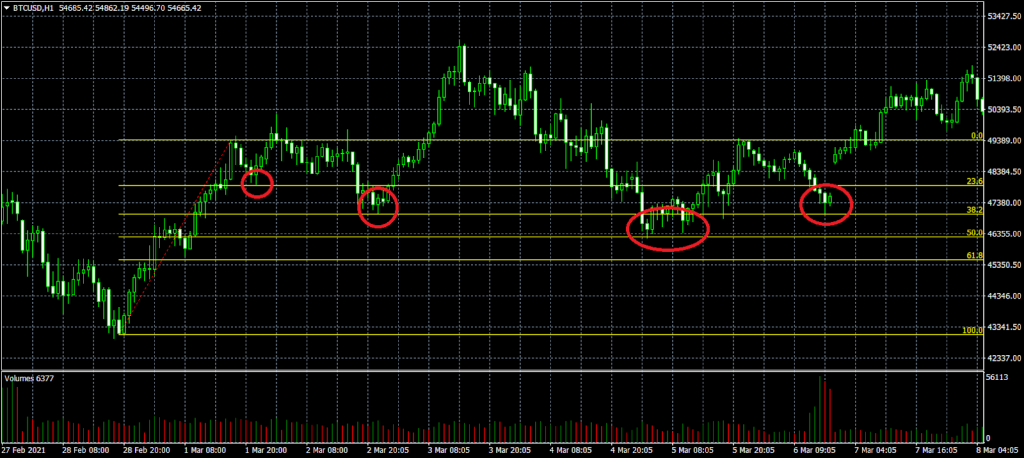

By drawing the lines over the bullish moves, you can monitor potential support levels that may be tested by the price in the case when the market corrects or retraces, hence the term retracement. Based on the support levels provided by the Fibonacci tool, traders can open long positions or set stop losses for longs.
Fibonacci in Downtrend
Elsewhere, if you trade during a bearish market, the low point would be 0%, while the peak 1 (or 100%). Since the price is declining, an eventual retracement would mean a rebound. Thus, the Fibonacci retracement tool can show you the potential resistance levels. Here is what you should do:
- Determine a downtrend;
- Add the Fibonacci tool on the chart at the top of the trend and drag it to the right, all the way to the low;
- Check the three potential resistance levels at 0.236, 0.382, and 0.618.
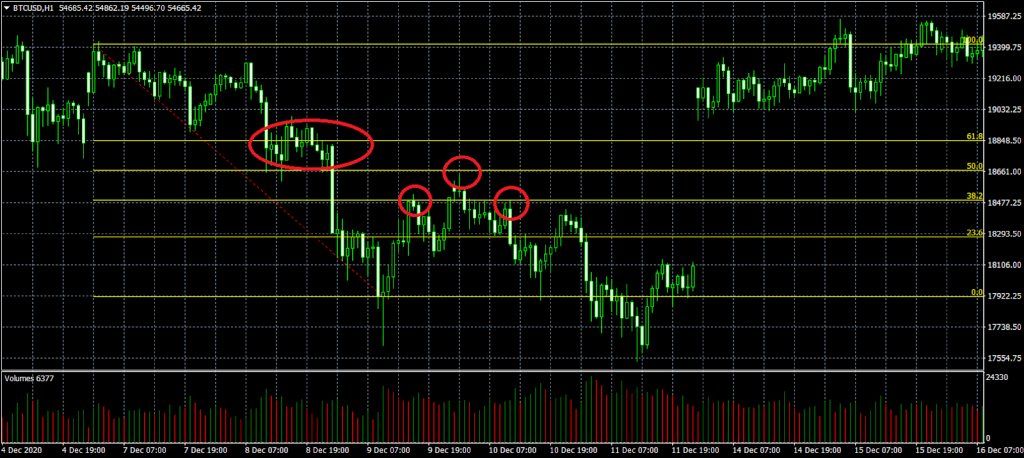
Based on the resistance levels, traders may choose to open short positions, close the existing longs, or set stop losses and take profits for shorts.
What Does Fibonacci Retracement Tell You?
Fibonacci levels are used to determine support and resistance levels between any two given points, and that can help you decide on the best entry points, price targets, or stop-loss levels. Each trader has his own style and can implement the Fibonacci retracement tool in his own way.
Some strategies aim to generate profits based on the price movement between two specific Fibonacci levels. Let’s say that we are trading during a bullish market and spot a retracement. Going long at the 38.2% retracement level and then exiting the market at 23.6% could be an interesting approach. As mentioned, it very much depends on the individual profile of a trader.
Generally, the Fibonacci retracement tool is used in combination with other indicators. It may be used alone but only for analysis purposes. Also, traders can use other indicators for their strategies and rely on Fibonacci levels to set the stop loss or take profit levels.
Some traders prefer to combine Fibonacci retracement levels with Elliott Waves, which we described in a previous article. The Elliott Wave Theory is a complex pattern consisting of wave structures whose changes can be conditioned by the Fibonacci levels. The merger between Elliott Waves and Fibonacci Retracements can make a powerful strategy to figure out the potential support or resistance in different market conditions.
It’s very important to highlight the fact that the price might defy the Fibonacci levels. Remember that markets are unpredictable, especially in the case of cryptocurrencies. Thus, don’t ignore the risk management rules.
Pros of and Cons of Fibonacci Retracements
There is no perfect technical analysis indicator. Thus, the Fibonacci retracement has its advantages and limits.
Pros of Fibonacci Retracement
One of the advantages of the Fibonacci tool is that it can be used to anticipate future price movements. Most indicators derive from the historical price data, which can’t be said about Fibonacci retracement. It’s true – the lines are drawn from existing points representing highs or lows, but they look into the future rather than analyzing the past.
Resistance and support levels are critical, and many strategies revolve around them. The fact that the Fibonacci levels help traders determine resistance and support makes the indicator very useful.
Limitations of Fibonacci retracements
First of all, implementing Fibonacci retracements requires some training. Most beginners don’t use the tool because it seems to be sophisticated, though this might be a misconception. Another risk is that even when beginners seem to have a better understanding of the indicator, they may rely too much on the indicator. If you simply plot the Fibonacci retracement levels on the chart, it doesn’t mean you will secure profitable trades.
Some traders don’t prefer the indicator because there are many Fibonacci levels, which makes the tool less relevant. The price may reverse near any of those lines, and traders struggle to figure out which one will be useful to monitor at any given time. When one of the levels doesn’t work out, it can be argued that the trader should have checked another retracement level instead.
Does Fibonacci Retracement Work at All?
Some argue that the Fibonacci retracements don’t necessarily work because the lines are subjective even though they are based on the Fibonacci sequence. But here is the thing – most traders know about the tool and many of them use it very often. Thus, there are many traders that expect the same thing to happen when the price is fluctuating near one of the Fibonacci levels. In this way, the retracements become a self-fulfilling prophecy since everyone has similar expectations.
So the short answer is yes – thanks to the crowd behavior, the indicator is helpful if you know how to use it. You can simply go back and analyze our chart examples, and you’ll see that the price does often retrace near the Fibonacci levels.
Fibonacci Extensions
Besides Fibonacci retracements, there are also Fibonacci extensions. The latter can be used to anticipate potential significant resistance or support levels outside a given range. You can think about Fibonacci extensions as target levels. The first extension levels are 138.6%, 150%, and 161.8%, and then there are 261.8% and 423.6%. However, the last two ones are not used very often, if at all.
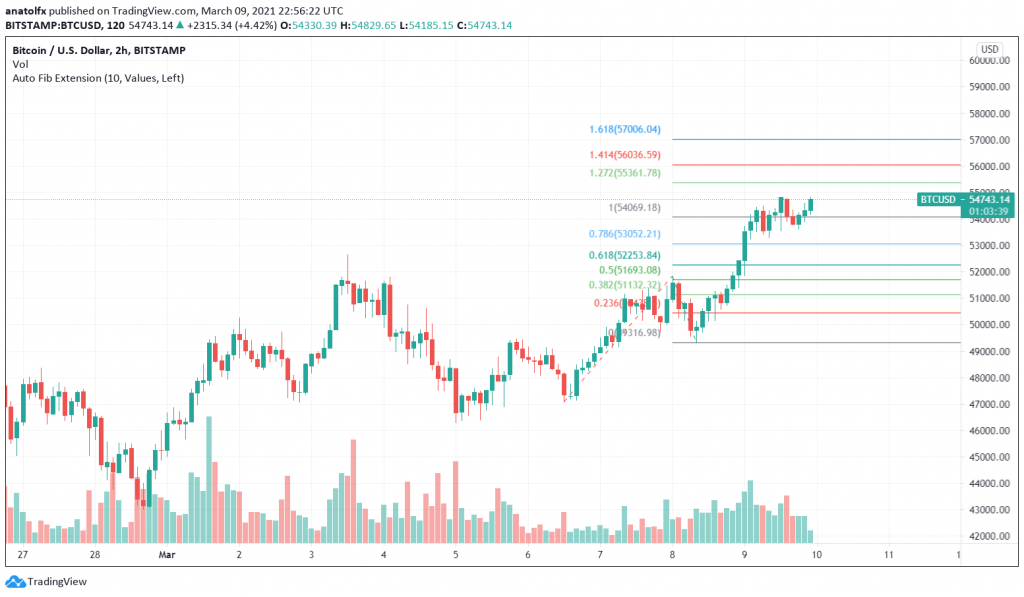
On TradingView, you can find the indicator under the name “Auto Fib Extension,” which means that the tool is automatically determining the starting point on the chart. Thus, you don’t have to identify a swing high or a swing low – the system does it for you. As you can see in the example below, the indicator picked a swing low that coincides with the start of a short-term rally. You can see three Fibonacci Extension lines, which represent resistance levels where the price can start to pull back if it continues to increase.

The Final Note
Fibonacci retracements and extensions are some of the most interesting and helpful technical analysis tools. While they may seem tricky at first, using them is not that complicated. On the contrary, retracements usually make the trader’s life easier.
The great thing about the tool is that it revolves around support and resistance levels, which are so important in understanding the markets and anticipating future movements.
Still, it is not recommended to rely on Fibonacci levels alone. The best option is to combine them with another technical indicator or integrate them into an existing strategy in an effort to aim for confluence.