
Trading cryptocurrencies is not easy, but that doesn’t mean it shouldn’t be simple. One of the best technical analysis indicators that can provide clear signals in different market conditions is Bollinger Bands. Traders can use the bands either independently or in combination with other indicators to confirm bullish or bearish signals.
Bollinger Bands are relevant for crypto traders because they revolve around volatility, which makes a separate category of technical analysis tools, along with trend-following, momentum, and volume indicators. Given that digital assets show extreme fluctuations, using the bands can improve traders’ decision-making capabilities substantially. It is the most preferred tool from the volatility indicators group.
The indicator was created in the 1980s by John Bollinger, an American investor and financial analyst. He is a CFA (Chartered Financial Analyst) Chartholder, meaning that he has the highest level of recognition for investment professionals, which is provided by the CFA Institute. Bollinger created the indicator for stocks, as he focused on options at the time. Still, the tool works well for any asset, and it certainly makes sense to apply it for cryptocurrencies, given their volatility. The name of the indicator came out spontaneously during a TV interview on Financial News Network (FNN). When the reporter asked what the bands were, Bollinger replied, “Let’s call them Bollinger Bands.”
Interestingly, Bollinger Bands is probably one of the few if not the only indicator that has its official website curated by the creator himself. The site is managed by his investment management firm called Bollinger Capital Management.
What Exactly Are Bollinger Bands?
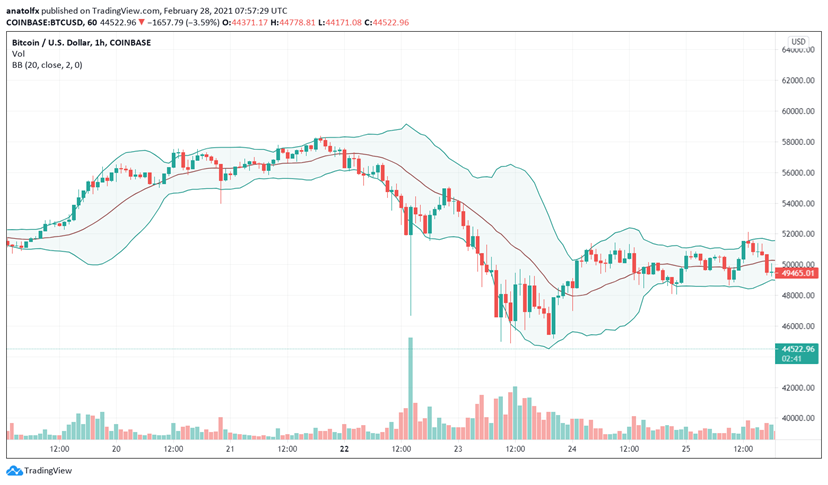
Bollinger Bands are made of three lines that engulf the price action, forming an envelope that moves with the price. The middle line represents a simple moving average (SMA), and the upper and lower lines represent standard deviations of the middle line. Let’s have a first look, and then we’ll discuss what these deviations are. So here is what the bands look like on the chart:

Bollinger Bands help crypto traders figure out the current trend, assess the price volatility, and anticipate trend reversals. Their main purpose is to show the relative positions of the highs and lows of a market.
By default, the indicator’s middle line is an SMA with period 20, while each of the two bands represents two standard deviations. Since the distance between the bands is determined by the standard deviations derived from the SMA, they widen when volatility increases and narrow when the market is calm.
The main component of the indicator is the moving average (MA), which is the most common technical indicator out there. It’s literally everywhere. It represents the arithmetic mean of an asset’s prices over a given number of periods, such as minutes, hours, or days. The MA can be set to represent close, open, low, and high prices. The number of periods tracked by the MA is also adjustable. It’s important to mention that the MA is lagging, given that it considers historical prices. Thus, Bollinger Bands are also a lagging indicator, and it cannot predict future movements. Instead, it provides insights into the price action and reveals market conditions that cannot be observed with the naked eye.
The simple moving average we use in Bollinger Bands is nothing else than the typical moving average, but we call it simple to differentiate it from other MA categories, such as exponential moving averages (EMAs).
That being said, the SMA is the first violin in Bollinger Bands. The other two lines derive from it. Before John Bollinger, financial analysts and traders used fixed-width trading bands, but he was the first to use volatility-related standard deviations to make these adaptive. So what are these standard deviations? The statistical concept is meant to show how dispersed numbers are relative to a given value. For instance, if the upper band is set at one standard deviation, this suggests that about 34% of recent price moves above the SMA are contained within the range between the SMA and the upper band.

When applying the lower band as well, that means 34% of recent price moves below the SMA are contained within the channel formed by the SMA and the lower band. Thus, a total of 68% of recent price moves are included within the upper and lower bands. As mentioned, the Bollinger Bands indicator uses two standard deviations, and that means that a total of 95% of price moves within a monitored period are contained within the range formed by the two bands, as shown in the first chart (over 47% for each of the bands). Here is how much can be covered by various standard deviation values:
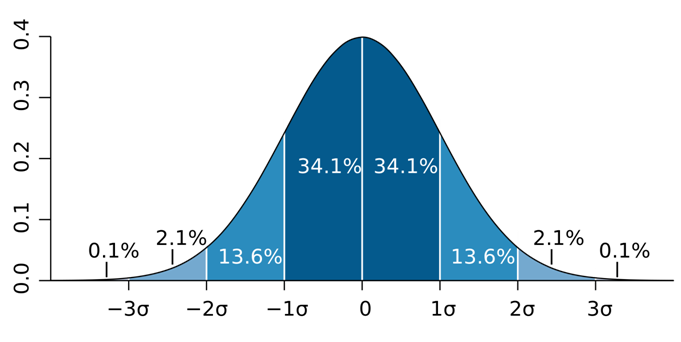

https://en.wikipedia.org/wiki/Standard_deviation#/media/File:Standard_deviation_diagram.svg
How to Use Bollinger Bands?
Traders use Bollinger Bands in many different ways, but we’ll discuss the most popular approaches. It’s worth mentioning that using the bands when trading digital assets isn’t fundamentally different than employing the indicator with traditional assets, whether it’s about stocks, foreign exchange pairs, commodities, or bonds. Still, cryptocurrencies can provide more signals due to their higher volatility.
To begin with, here is how you should set the indicator based on your trading style:
- Short-term – SMA with period 10 and bands at 1.5 standard deviations;
- Medium-term – SMA with period 20 and two standard deviations. These are the default parameters so you shouldn’t change anything.
- Long-term –SMA with period 50 and bands at 2.5 standard deviations.
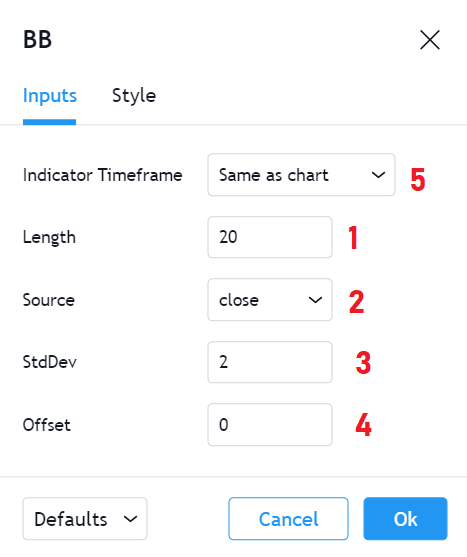
Most of the chart providers allow you to change other parameters as well. For example, on TradingView, which is the most popular chart provider that is integrated by many crypto exchanges, you can adjust the following:
- The SMA period (1);
- The price source – such as close, open, low, high, etc. (2);
- The standard deviation value – note that you can use decimals as well (3);
- The offset value – the higher is the input, the larger is the lag or deviation of the entire indicator from the price action (4);
- The indicator timeframe – you can set the indicator timeframe to be independent of the chart timeframe, which will make the indicator update faster or slower than the main chart.

Two of the most important trading strategies that go well with Bollinger Bands are known as Bollinger Bounce and Bollinger Squeeze.
Bollinger Bounce
Bollinger Bounce is a trend reversal strategy. The main principle behind it is that the price always tends to pull back to the middle line whenever it touches the upper or lower band. Simply put, when Bitcoin or an altcoin hits the upper line of the indicator, traders would be interested in going short. Conversely, when the price touches the lower band, traders would place Buy orders. You can treat the bands as resistance and support levels that are moving in real-time.
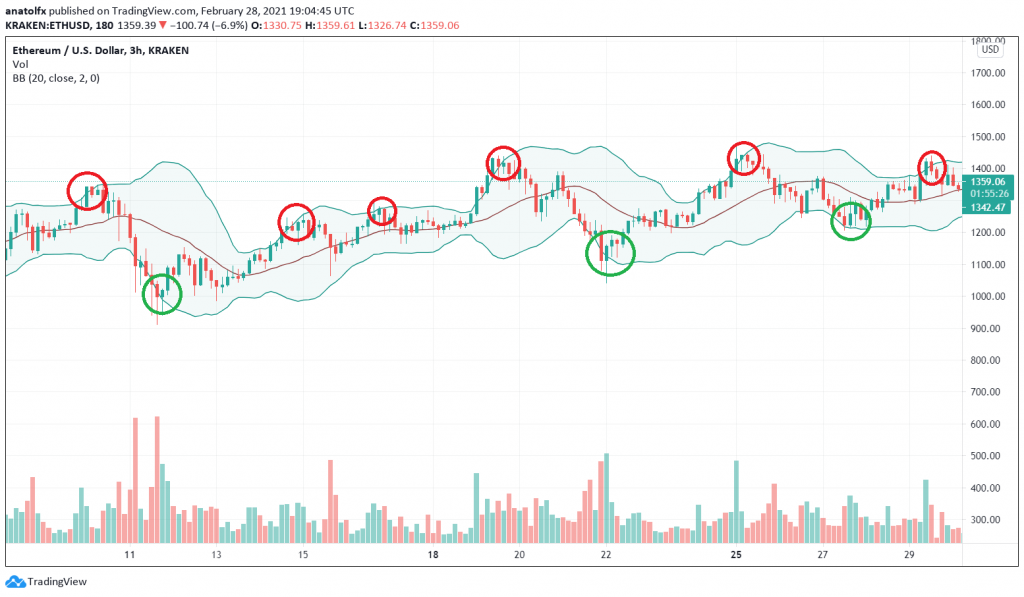

Note that the strategy works better during horizontal trends when the cryptocurrency’s volatility is not that high. Usually, novice traders prefer to enter positions during rallies or steep declines, but Bollinger Bounce can turn into a profitable strategy during sideways moves as well. When the bands start to expand, you should stop using this trading system, as the price is forming a new trend. Also, the relevance of the bands in the context of this strategy increases with larger timeframes, which is why Bollinger Bounce is preferred by swing traders.
Bollinger Squeeze
Another popular strategy applied with the indicator is Bollinger Squeeze. It also provides its signals during low market volatility. When the bands squeeze together, you should prepare for a breakout in either direction. If the price starts to ascend above the upper band, you would be interested in going long, as the price is likely to continue rallying for a while. If the price breaks below the lower band, traders either go short or exit their existing longs, as bears are gaining control over the price.


However, even if the price breaks above the upper band or below the bottom line of the indicator, you should wait for confirmation that a new trend is forming indeed. Otherwise, you may get a false signal from an isolated drop or spike.
There are many trading strategies based on Bollinger Bands, but these two strategies are the most popular ones. Besides the two, you can also trade the so-called W-bottom and M-tops.
W-Bottoms and M-Tops
W-bottoms and M-tops are patterns that appear on the candlestick chart. They resemble double bottoms and double tops, though they apply the Bollinger Bands indicator.
To confirm a W-bottom, you have to check whether the first low of the price action, which is usually beneath the lower band, is lower compared to the second bottom, which must be inside of the bands. When the cryptocurrency rebounds from the second low, you’d be interested in going long.
The M-top is simply the opposite of a W-bottom. The pattern shows up when an uptrend reaches the overbought level and ends up with a correction followed by another test of the resistance defined by the previous high. If the cryptocurrency price fails to break through the resistance, it forms a pattern similar to a double top. Again, you should make sure that the first high is outside the Bollinger Bands while the second one keeps inside the bands. When the price starts to pull back from the second high, you would be interested in going short.
Trend-following strategies
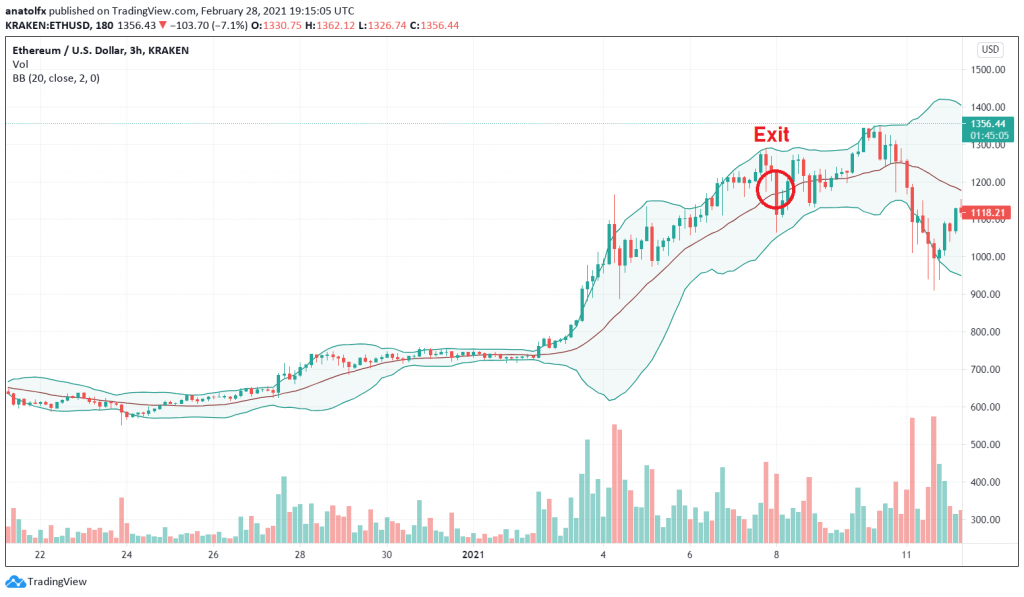
Some traders prefer to use Bollinger Bands for trade-following strategies. What is common for trend-following strategies is that traders go long when the price is already increasing and go short when the price is already declining. The rationale behind this approach is that the existing trend is expected to continue for a while.
So how can you integrate the bands into this trading system? It’s simple – when the price is fluctuating above the middle line for a while, an uptrend is confirmed, and you’re free to go long at any point. You should exit the market as soon as the price breaks below the middle line because a trend reversal might be just around the corner.
Bollinger Bands Pros and Cons
Like any other technical analysis indicator, Bollinger Bands have both advantages and drawbacks.
Traders like the bands because they reveal the volatility of an asset in real-time, which helps you better comprehend the market conditions. Also, they are user-friendly and work well both in volatile as well as calm markets.
Still, Bollinger Bands are lagging, and that means you have to wait for the confirmation of any signal. Cryptocurrencies are more unpredictable, which reduces the relevance of a lagging indicator. John Bollinger himself said that the bands should be used in combination with other indicators and that they are not fool-proof.
Bollinger Bands Variations
You may be interested in using Bollinger Bands variations as well, such as Bollinger Bands Width and Bollinger Bands %B (percent bandwidth). The latter is the most popular variation, and it actually includes the former one too. Unlike the typical bands, Bollinger Band %B is displayed below the chart similarly to the Relative Strength Index (RSI) or Stochastic. It quantifies the position of the cryptocurrency price relative to the bands as follows:
- When %B is higher than 1, it tells you that the price is above the upper band;
- When %B is 1, it shows that the price is touching the upper band;
- When %B is above 0.50, it shows that the price is above the middle line;
- When %B is below 0.50, it suggests that the cryptocurrency price is below the middle line;
- If %B is at zero, it means that price is at the lower band;
- When %B is below zero, it tells you that the price is below the lower band.
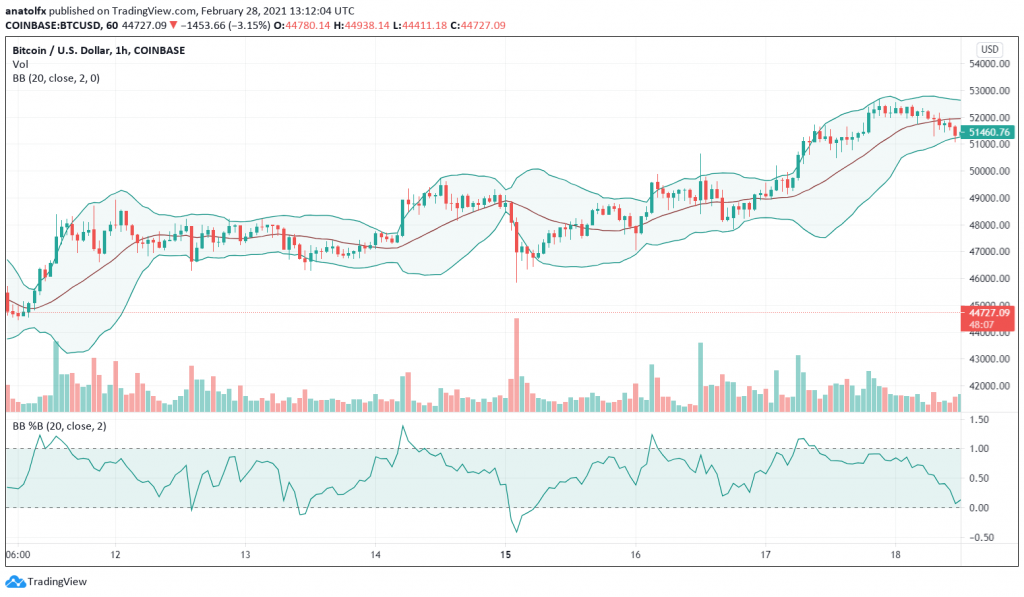
This variation is used as a momentum indicator, i.e., it shows the overbought/oversold market conditions.
The Final Note
To recap, Bollinger Bands are the main volatility indicator. It was created by John Bollinger about four decades ago and is used for trading all markets, including cryptocurrencies.
Here is a roundup of the Bollinger Bands’ features:
- Bollinger Bands is an indicator consisting of three lines: a 20 SMA plus an upper and lower line, each representing two standard deviations from the middle line.
- The indicator measures the volatility of the price, though it can also define the existing trend as well as the overbought and oversold levels.
- The bands squeeze when the market is calm and expand during volatility.
- The price tends towards the middle line. Thus, whenever it touches one of the bands, traders anticipate a pullback in the opposite direction.
- If the bands have been narrow for a while, traders should expect a breakout in either direction.
Make sure to test the indicator before using it!