
Cryptocurrency traders are lucky to use all the technical analysis indicators initially designed for traditional markets. One of the most interesting such tools is Ichimoku Cloud, which still looks exotic for most beginners.
In the present article, we’ll discuss the main aspects of Ichimoku and see how to use it in crypto trading. Ichimoku is one of those indicators that, when plotted on the chart, makes you look like the Einstein of trading. However, there is nothing difficult about this indicator, and it can be used by novice traders as well.
What Is the Ichimoku Cloud?
The Ichimoku Cloud is a technical indicator that helps traders identify support and resistance levels, assess momentum, define the direction of the trend, and get decent trading signals. The full name of the indicator is “Ichimoku Kinko Hyo,” which literally means “one glance equilibrium chart.” Basically, with a single look, you get a ton of information on the price action.
The indicator was created about a century ago by Japanese journalist Goichi Hosoda, who was known as Ichimoku Sanjin. After developing it based on the analysis of rice markets, Hosoda spent about three decades perfecting the technique before sharing it with the public in the 1960s.
By the way, did you know that the candlestick chart was invented by a Japanese rice trader named Munehisa Homma? It seems that we owe very much to the Japanese. It’s interesting to know why the entity known as Satoshi Nakamoto chose that particular nickname.
Back to Ichimoku, the indicator relies very much on multiple averages, which is why it is very helpful at determining the general trend. However, Ichimoku’s average lines depend on the highs and lows as opposed to the close price displayed by candles.
The Main Aspects of Ichimoku
The Ichimoku Cloud indicator consists of five lines, also known as plots. Here they are:
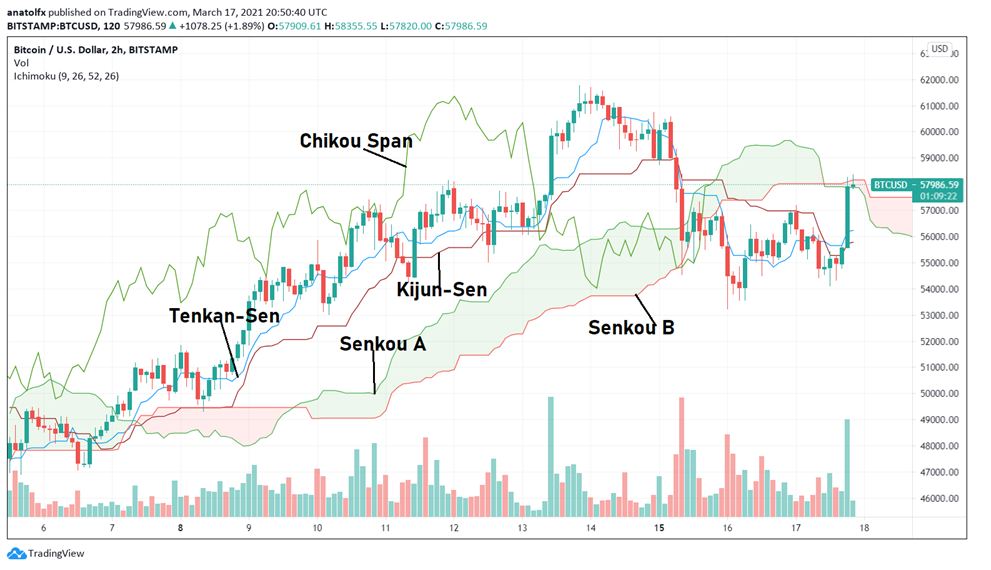

- The conversion line, also known as the Tenkan-sen – it represents the nine-period peak plus the nine-period low, divided by two. In other words, it reflects the midpoint of the two extremes (high-low) of the latest 9 periods, which are determined by the timeframe used (for example, M1, H1, D1).
- The base line, also known as the Kijun-sen – this is the 26-period high plus the 26-period low, divided by two. Similar to the conversion line, Kijun-sen is the midpoint of the high-low range, but at this time, it covers the latest 26 periods.
- Leading span A, also known as the Senkou Span A – it represents the conversion line plus the base line, divided by two. The leading span A forms the upper of the cloud boundaries.
- Leading span B, also known as the Senkou Span B – this is the 52-period high plus the 52-period low, divided by two. This line forms the lower boundary of the cloud.
- Lagging span, known as the Chikou Span – it displays the current close price levels plotted 26 periods in the past.
The Senkou lines (A and B) are forming the cloud, which is called Kumo. The cloud edges provide traders with current and potential future support and resistance levels.
Whenever the cloud is expanding, it means that the volatility of the price is increasing. When the cloud is narrowing, that means the marking is calming down, and the provided support and resistance levels are not reliable, as the price can break above or below the cloud sooner or later. The cloud can be treated quite similarly to the Bollinger Bands, which we discussed in a previous article.
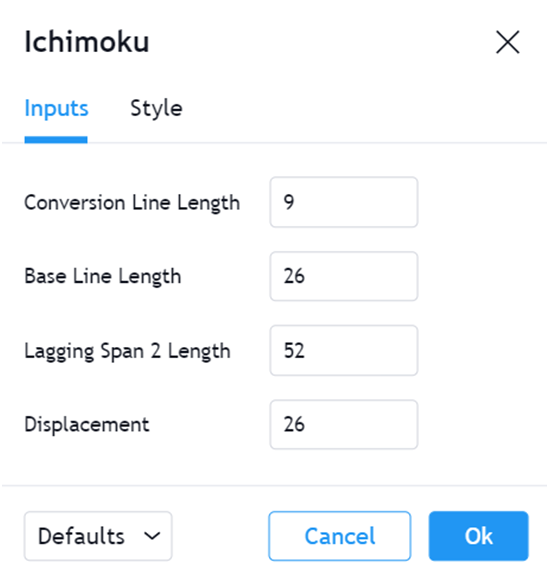
Setting the Ichimoku Cloud
The Ichimoku Cloud is quite flexible when it comes to tuning it to find the best version that matches a particular trading style or profile. Note that Hosada spent about three decades perfecting it, and he concluded that the 9, 26, 52-period setting had the best results. Still, you should understand that Hosada adjusted it for the Japanese markets of that time. Back then, Saturday was also a working day for Japanese businesses, and the 9-period of the Conversion Line represents a week and a half (6+3 days). In a similar fashion, the 26 and 52 periods represent one and two months, respectively.
Cryptocurrency traders often tune the Ichimoku Cloud to reflect the 24/7 markets. Thus, they change it from 9, 26, 52 to 10, 30, 60. Some traders even use the 20, 60, 120 setup to get more reliable signals.
However, there is an ongoing debate whether these modifications provide better signals. Some say that ignoring the standard setting may disrupt the balance of the indicator.
Nevertheless, modifying Ichimoku’s period is quite easy on TradingView, MT4, as well as the rest of the charts that provide the indicator.

What Does Ichimoku Cloud Tell Us?
Ichimoku is a multifunctional technical analysis tool, and you can’t put it in a single category. Here are several things that you can get from this indicator:
- As a rule, the market is bullish when Senkou Span A is above Senkou Span B, and vice versa. Traders often pay attention when the cloud twists, which suggests a potential trend reversal. Usually, when the Leading Span A is above Leading Span B, the cloud is colored green. In a bearish scenario, the cloud is colored red. Note that the cloud is anticipating the future, which sets this indicator apart.
- Apart from counting on the cloud alone, you may conclude that the general trend is bullish when the price is above the cloud and vice versa. If the price is in the cloud, then it is either moving sideways or is transitioning.
- As we mentioned, the thickness of the cloud reflects the volatility of the price. Besides this, traders can monitor the cloud’s angle. If it points upwards, then the cryptocurrency is bullish.
- Traders may use the cloud as an area of support or resistance, depending on its position relative to the price. The great thing about it is that it projects the support or resistance area into the future.
- The purpose of Chikou Span is to simply define the current market sentiment. When it hovers below the price, then the general sentiment is bullish, and vice versa.
- As for the Conversion and Base Lines, they are used to provide trading signals.
We can group the signals provided by the Ichimoku Cloud into three main categories:
- Momentum signals – they are generated based on the relationship between the price action, Conversion Line, and Base Line. Thus, the market is bullish when either or both the Conversion Line and the price action move above the Base Line. Similarly, bearish momentum signals are generated when the Conversion Line, the market price, or both of them move below the Base Line.
- Trend-following signals – trend signals are generated based on the cloud’s color and the position of the price in relation to it. Thus, when the color of the cloud is green (Leading Span A is above Leading Span B) and the price is above the cloud, then we deal with a bullish market and vice versa.
- Volatility signals – as mentioned, when the distance between Leading Spans A and B grows, it suggests that the price is more volatile.
Speaking about the quality of the signals, their strength depends on whether they are in harmony with the broader trend. Any signal that is in line with the larger trend will be stronger than the signals going against the trend. In other words, a bearish signal might not be reliable if it’s not accompanied by a bearish trend. Thus, you have to check the general trend first in order to assess the quality of the different signals that Ichimoku provides. Fortunately, the indicator itself is very helpful at determining the general trend. Also, it is recommended to check the volume in order to assess the value of a signal.
While some of the Ichimoku Cloud’s signals make sense in any timeframe, the indicator tends to generate many false signals and a lot of noise with shorter timeframes, such as M1 and M15. As a rule, larger timeframes, such as H4 or D1, can generate more reliable signals.
How to Use Ichimoku Cloud in Cryptocurrency Trading?
Given that the Ichimoku Cloud is so multifunctional, traders use it in many different ways, but here is one of the most popular trading approaches:
Traders buy when the Tenkan Sen (Conversion Line) crosses the Kijun Sen (Base Line) from bottom to top, while both lines and the price are all above the cloud.
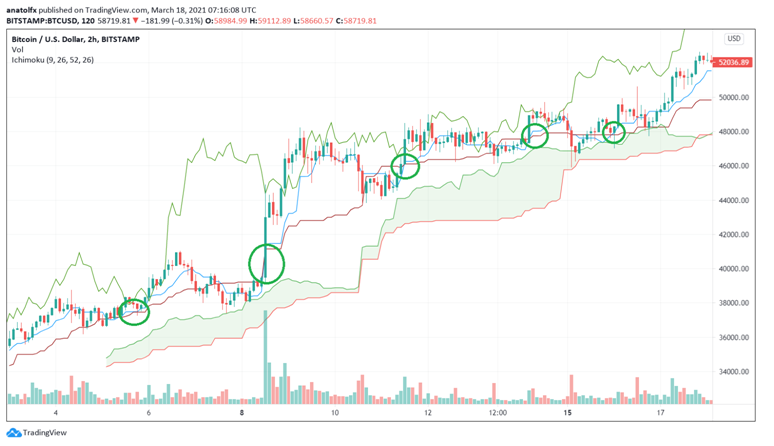

Conversely, a sell signal is reinforced when the Conversion Line crosses the Base Line from top to bottom, while both of them and price are all below the cloud.

Pros and Cons of Ichimoku Cloud
The Ichimoku Cloud is an interesting indicator, but as with any indicator, it has its strengths and flaws. Here are the pain pros and cons of Ichimoku:
Ichimoku Pros
Ichimoku is one of the few if not the only well-established indicator that tries to anticipate the future movement of the price. The cloud or Kumo is projected 26 periods ahead, which can provide reliable hints about the future resistance and support levels.
Many traders prefer Ichimoku because it is so universal and multifunctional. It can provide all kinds of signals, such as momentum, trend-following, and volatility. It even does a great job at reflecting the market sentiment, thanks to the intelligent use of the Chikou Span line, which simply represents the current price plotted several periods backward.
Ichimoku Cons
While the indicator looks quite imposing, its performance hasn’t been proven when it comes to the most sensitive and important signals.
Even though the Ichimoku Cloud has projections into the future, it is obvious that the visual representation relies on past data. Cryptocurrencies are very volatile and might not necessarily comply with the projections generated by the cloud.
The Ichimoku Cloud might become less relevant in short timeframes, so scalpers might not prefer it at all. Also, it can become less relevant for longer timeframes as well, as the price keeps way above the cloud or below it for a long period of time. You could say that the indicator makes sense for swing traders.
Beginners might be confused during their first interaction with the Ichimoku Cloud, as the chart looks so busy with all the lines surrounding the price action. The good news is that most charts enable certain lines to be hidden. For example, you can leave only the cloud to avoid distraction. Or you can hide only the Chikou Span line if the sentiment is already clear.
Ichimoku Cloud vs. Moving Averages
As you can see, the Ichimoku Cloud relies on multiple averages. However, it is important to mention that they are different from typical moving averages that we’re so familiar with, and this is actually visible when you analyze how the main lines are calculated. In the case of moving averages (MAs), the formula is to take a set of price points, such as 12 close prices, and divide the resulted sum by the number of price points, which is 12 in our case.
The calculations for the Ichimoku Cloud averages are quite different. First of all, they are based on highs and lows over a period, rather than the close prices. Also, the resulted sum is divided by two and not by the number of periods.
The moving averages and the average lines generated by Ichimoku are calculated differently, but that doesn’t mean one indicator is better than the other.
The Final Note
Despite its complexity, the Ichimoku Cloud can be quite helpful at analyzing the price action from multiple perspectives.
Thanks to its increasing popularity, the Ichimoku Cloud is not perceived as an exotic indicator anymore.
Still, beginners may find it intimidating at first. If you’re new to trading, you should practice Ichimoku on a demo account or at least analyze it on the chart to get more familiar with it.
Also, you can combine Ichimoku with other indicators, such as the Relative Strength Index (RSI). At least the RSI is displayed below the main chart.