
Cryptocurrency traders are lucky to have borrowed all the ready-made technical analysis tools tested and perfected in traditional industries, such as stock, foreign exchange, and commodity markets. Most technical analysis tools are market agnostic, as human behavior is the same in all markets. It’s true that Millenials and Generation Z dominate the crypto space, but that makes no real difference, as crowd psychology doesn’t care about generation profiles.
One of the most interesting technical analysis theories is the Elliott Waves Theory, and we’ll discuss it in the present article. To begin with, the Elliott Wave is not a technical analysis indicator, though there are customized tools based on this theory. Instead, you can think of it as a pattern that can be applied for any asset and timeframe. Thus, you can implement it successfully when trading cryptocurrencies, including Bitcoin and altcoins.
What Are Elliott Waves?
Many cryptocurrency traders, especially beginners, are not aware of the Elliott Wave. This is a theory or method that describes price fluctuations in financial markets, which are moving in fractal wave patterns. The theory was first developed in the 1930s by Ralph Nelson Elliott – a US accountant. However, it became really popular about five decades later, thanks to financial authors and stock investors Robert R. Prechter and A. J. Frost, who wrote the book “Elliott Wave Principle: Key To Market Behavior.” Prechter then founded the Elliott Wave International.
So what’s the Elliott Wave principle anyway? In a nutshell, the Elliott Wave Theory (EWT) argues that market movements occur based on a certain pattern caused by the crowd psychology cycles. The pattern can be observed irrespective of the timeframe. Essentially, these patterns show up based on the market sentiment, which switches from bullish to bearish and vice versa.
The Elliott Wave Pattern
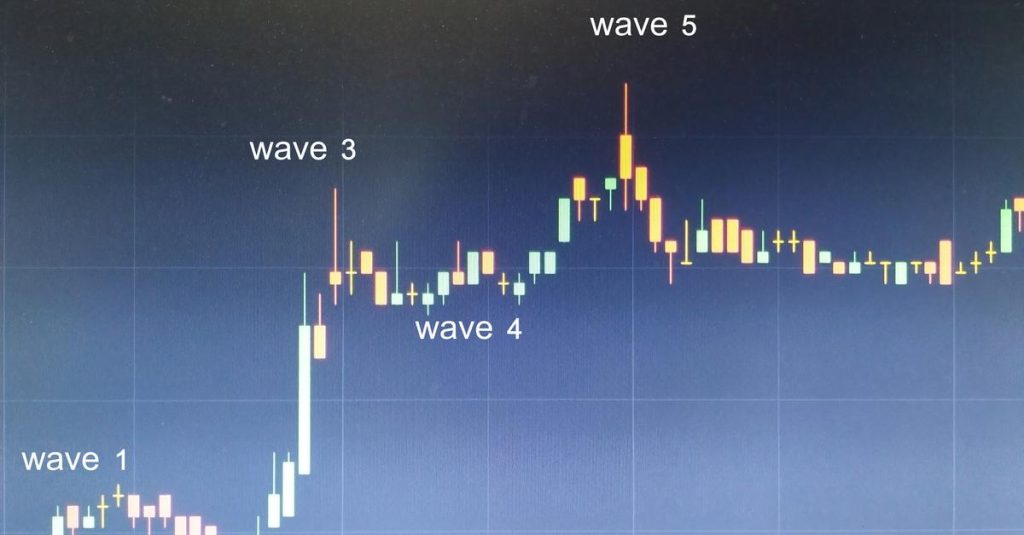
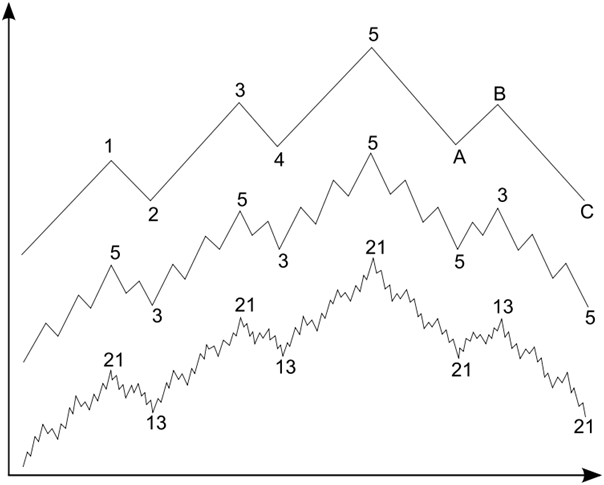
The basic Elliott Wave represents an eight-wave pattern, which consists of five Impulse Waves (which move in the direction of the general trend), and three Corrective Waves (which move against the major trend). Here is what the Elliott Wave cycle looks like in a bullish market:
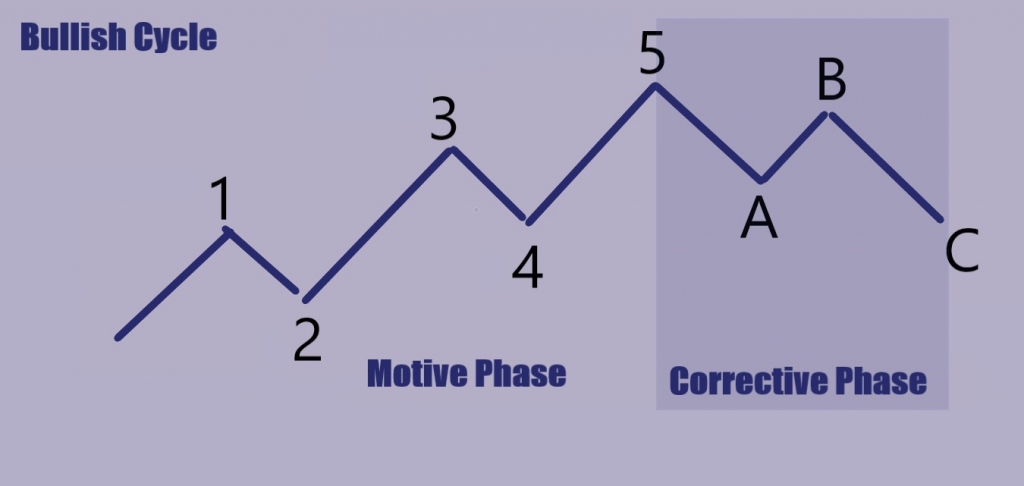

As you can see, there are five Impulse Waves: three are found in the upward move (1, 3, and 5), and two can be seen in the bearish move (A and C). Elsewhere, the Corrective Waves are 2, 4, and B. The whole upward move (from wave 1 to 5) is often referred to as the Motive Phase – it moves in the direction of the general trend. The Corrective Phase is from wave A to C.
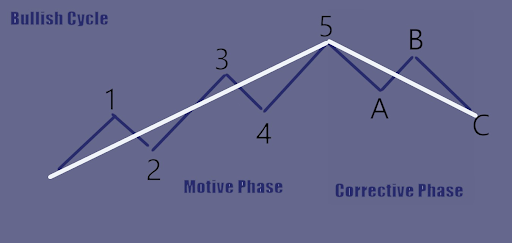
The interesting thing is that financial markets form these patterns of fractal nature. Thus, if we zoom out to see larger timeframes, then the movement from 1 to 5 (the Motive Phase) can be regarded as a single Impulse Wave in a much larger pattern, while the A-B-C move (the Corrective Phase) in this case will be a single Corrective Wave.

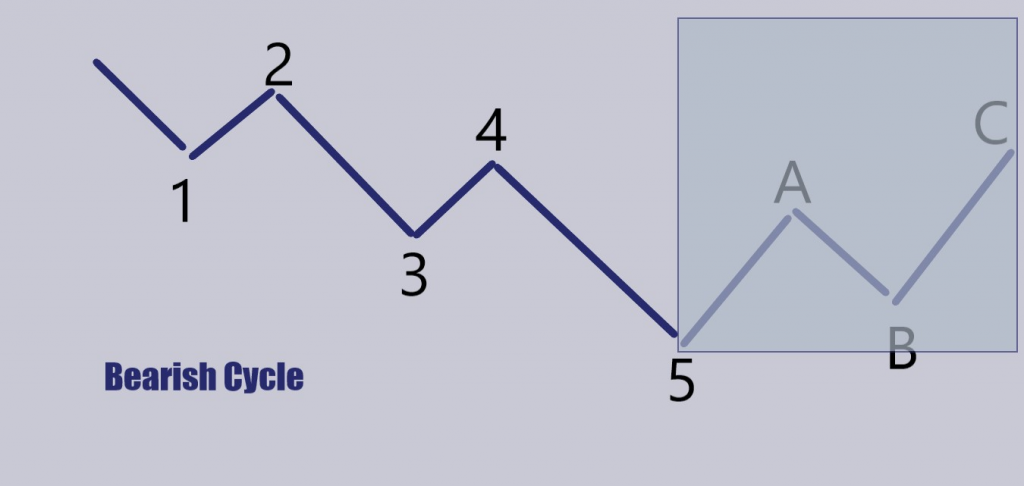
While we used the bullish move as an example, the EWT works similarly in bearish markets. Here is what the pattern will look like when the sentiment is bearish:
It’s worth mentioning that many sources might use Impulse Waves and Motive Waves interchangeably since they’re generally the same. However, for the sake of convenience, we’ll call Impulse Waves the smaller moves that can be part of a Motive Phase, which is larger.
What Are Fractals?
If mathematics and geometry are not yours, knowing that the Elliott Wave Pattern is a fractal doesn’t help very much, right? So what are these fractals? Without going too much into details, fractals are never-ending patterns that repeat themselves or are self-similar across different scales.
There is an entire culture and art built around fractals, as they are so predominant in nature. For example, trees, mountains, rivers, and seashells are all examples of fractals. In the case of a tree, the trunk can be treated as a bigger branch, while the branch can be viewed as a bigger twig, and so on.
There are artificial fractal patterns as well. The most popular one is the Mandelbrot Set, created by American mathematician Benoit Mandelbrot. It is based on a function that can theoretically be iterated infinitely (a computer is used to conduct as many iterations as possible). The results of each iteration are then displayed on a two-dimensional image (x-y axis) that is then translated into a beautiful image. When we zoom in and out, we can see different repetitive patterns that look similar to each other. Thanks to today’s powerful computers, we can enjoy the Mandelbrot Set at different scales – remember that the beautiful image is created by numbers!
https://www.youtube.com/watch?v=PD2XgQOyCCk
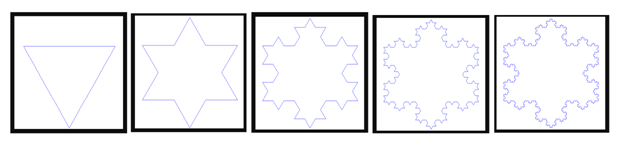
Another beautiful fractal is the Koch star or the Koch snowflake. Here are the first five iterations of the Koch star:

https://en.wikipedia.org/wiki/Koch_snowflake#/media/File:Von_Koch_curve.gif
Basically, a top pops out infinitely on every side of the figure. The beauty of this fractal is that it is theoretically finite and infinite at the same time – isn’t it mind-blowing?
So what do fractals have to do with finance? Well, if you ever tracked the price of any asset, you could observe that the price looks similar in any timeframe. In other words, if there was no information about the timeframe used, you couldn’t really tell the difference.
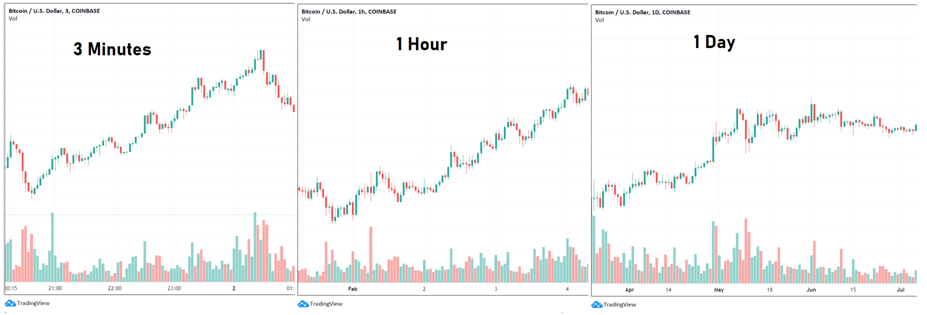

No matter how many times you zoom in or zoom out, there is a similarity in how the market behaves, as the sentiment and the conflict between bulls and bears is the same during a minute as well as during a year.
Back to the Elliott Wave Pattern, the author demonstrates that the theory works similarly on all timeframes, which is why we call it a fractal.

https://commons.wikimedia.org/wiki/File:Elliott_wave.svg
How Do Elliott Waves Work?
So how do Elliott Waves actually work? Well, as you’ll find out, the pattern has some strict rules. Before discussing the rules, you have to understand that the EWT has to do with human behavior. Elliott created his theory after analyzing market data for many years. His research covered at least 75 years of data.
Since the Elliott Waves represent a repetitive pattern, traders use them as a technical analysis tool to understand the potential next moves. As mentioned, they can work well in cryptocurrency trading as well. However, you should not think about it as a strategy or a technical indicator. Instead, you can treat the waves as an analysis method to understand market behavior. Based on that, you can make your own conclusions and maybe take the risk to open long or short positions, depending on the Motive Phase. Prechter himself said in his book:
“The Wave Principle is not primarily a forecasting tool; it is a detailed description of how markets behave.”
Now here are the rules that can help you anticipate the next moves:
Impulse Waves
As mentioned, Impulse Waves always move in the direction of the bigger trend. As shown in the examples above, the pattern has five Impulse Waves and three Corrective Waves. Still, if we zoom in to any single Impulse Wave, it will also consist of a five-wave formation, while the Impulse Wave will become the Motive Phase. This is what Elliott calls the Five-Wave Pattern, and here are his three main rules:
- Wave 2 can’t pull back more than 100% of Wave 1.
- Wave 4 can’t pull back more than 100% of the preceding Wave 3. Also, Wave 4 must never cross in the price area of the first wave.
- Wave 3 can never be the shortest of the Waves 1, 3, and 5. Often, it is the longest one.
Note that these rules are unbreakable. If any of these rules are violated by the price action, then the pattern is not a Motive Phase anymore, and you should not open positions based on it.
Corrective Waves
The Corrective Phase consists of three waves instead of five. Generally, they are referred to as A, B, and C. The Corrective Phase is usually made up of a Corrective Wave (B) that stays between two Impulsive Waves (A and C).
The Corrective Phase is always smaller because it moves against the general trend. In practice, the correction can vary substantially in length, which makes it difficult to depict it on the chart.
Nevertheless, according to Prechter, the most important rule to consider is that the Correction Phase is never made of five Waves.
Other Rules
While we discussed the unbreakable rules, there are other guidelines to consider:
- Guideline of equality – in any Motive Phase, Wave 3 should be the longest one, while Wave 5 tends to equal Wave 1. This helps traders understand where Wave 5 might end and thus when they may go short.
- Guideline of Alternation – in any Motive Phase, Wave 2 and Wave 4 will alternate in the following way: if Wave 2 is a steep correction, then Wave 4 will be a horizontal correction and vice versa.
- Guideline of Depth of Corrective Phase – if the price moves according to the Elliott Waves pattern and starts the correction phase, it will retreat to the area of Wave 4. While it might not reach the bottom of Wave 4, it shouldn’t go below that. This helps traders to understand where to expect the support (or resistance).
Are Elliott Waves Efficient?
The book by Prechter and Frost became really popular, especially when Prechter used the theory to predict a stock market rally and a crash in the 90s. Many traders combine the pattern with the Fibonacci retracement levels, which may hint at where the correction could start or end. Elliott himself concluded that “The Fibonacci Summation Series is the basis of The Wave Principle.”
However, the theory has some critics as well. You wouldn’t believe it, but Benoit Mandelbrot himself has questioned whether the EWT can anticipate the next moves of financial markets. He said:
“But Wave prediction is a very uncertain business. It is an art to which the subjective judgement of the chartists matters more than the objective, replicable verdict of the numbers. The record of this, as of most technical analysis, is at best mixed.”
Even in the case if critics are not right and the Elliott Waves work indeed, it is quite difficult for beginners to identify them on the chart. Crypto traders have to learn to divide the market movements into the Motive Phase and the Corrective Phase. In this way, the Elliott Waves are easier to spot. If you can detect the Motive Phase in a bullish market, you would be interested in going short after Wave 5, placing the stop loss somewhere above the top of Wave 5, and targeting a level close to the bottom of Wave 4.
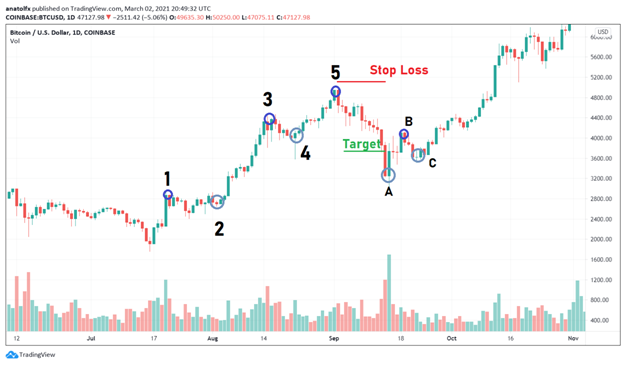

As you can see in this example, the correction actually went deeper below the bottom of Wave 4, which exceeded our profit target, but it doesn’t always happen like this. The point is that the market is not necessarily following any rules rigorously, especially the cryptocurrency market, which is still very young.
To support the case for the EWT, we must admit that there are many successful traders using it. Otherwise, the pattern wouldn’t be so popular.
Billionaire hedge fund manager and legendary trader Paul Tudor Jones called Prechter and Frost’s book on Elliott Waves one of “the four Bibles of the business.”
As mentioned, many traders would combine the EWT with other technical indicators, especially the Fibonacci Retracement and Fibonacci Extension.
The Final Note
To recap, the Elliott Wave pattern is made of a 5-3 wave cycle of an initial trend and a pullback. Elliott never speculated on why there is a 5-3 wave structure (Fibonacci sequence again?). Instead, he simply analyzed price data many years and figured out this pattern.
If you are a beginner, you should learn to spot the pattern on historical charts and then practice it with other technical indicators.
All in all, fractals and the Fibonacci sequence confirm that math is beautiful! And so might be your trading journey.