
Moving Average Convergence Diverge (MACD), better known simply as MACD, is one of the most popular and efficient technical analysis indicators used in cryptocurrency trading. It was borrowed from traditional markets, such as stocks, forex, and commodities. It does well with digital assets thanks to its capabilities to smooth price volatility, which is relevant for most cryptocurrencies.
The MACD looks somewhat similar to oscillators like Stochastic and the Relative Strength Index (RSI) because it is also regarded as a momentum indicator, meaning that it helps traders assess the strength of a trend. However, the MACD is more universal than the other two as it also acts as a trend-following indicator, i.e., it helps traders accurately define the direction of a trend.
Before jumping into the intricacies of the MACD, we’ll briefly mention its creator, because it has one. The MACD was invented by Gerald Appel, a money manager who became famous thanks to his financial articles and a number of investment books, such as “Winning Market Systems” and “New Directions in Technical Analysis.” He created the MACD in 1979 specifically for stock trading, but the price psychology is the same for any asset, and thus it works for cryptocurrencies as well.
What is MACD?
The MACD is both a trend-following and momentum indicator. It reflects the relationship between two moving averages of the price in real-time. In essence, the indicator is calculated by subtracting the exponential moving average (EMA) with period 26 from the 12-period EMA. What we get is the so-called MACD line. The indicator has a second line as well, which we call the “signal line.” The latter is a 9-period EMA resulted from the MACD itself, which is then plotted on the MACD line. It acts as a trigger to enter long or short positions.
Unlike the basic technical tools, traders can use this indicator in many ways. We’ll discuss how to use the MACD a bit later. Now let’s see what the MACD is actually made of.
Key Aspects of MACD
The MACD is a bit more complex compared to other popular technical indicators, such as moving averages or even the Relative Strength Index. It has three key elements: two lines and a histogram. To begin with, the two lines displayed by the indicator are not the two EMAs used for the calculations – many traders may be confused about those lines. So here is what the MACD consists of:
- The MACD line, which measures the distance between the two EMAs as discussed above;
- The signal line, which is a 9-period EMA of the MACD line. It is plotted on the MACD line. It acts as a trigger and notifies traders about the changes in momentum;
- The histogram – it measures the difference between the MACD line and the signal line.
Here is what the MACD looks like on the chart:
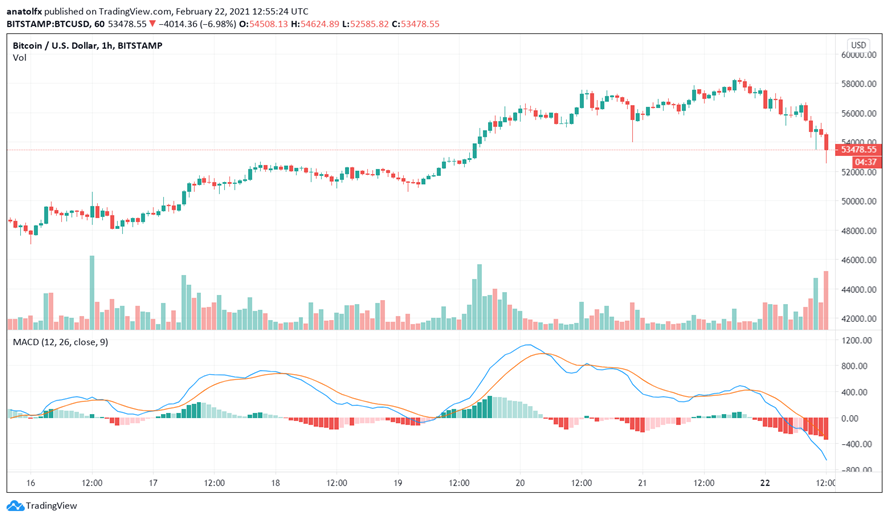

While the style of the histograms and lines may differ, the concept is the same. If we check the chart provided by TradingView, which is integrated by many crypto exchanges out there, the MACD line is blue, and the signal line is red. Nevertheless, you can change the style options from the indicator’s settings.
What are Moving Averages?
For those unfamiliar, the moving average (MA) represents the arithmetic mean (the average) of close prices over a specific number of periods, such as minutes, hours, or days (on the chart, the period coincides with the timeframe you choose, like M15, H1, H4, D1). The MA can be set to represent open, lows, or highs instead of close prices. You can also adjust the number of periods monitored by the MA. Note that the larger the MA’s time period, the great is the lag. And yes – all MAs are lagging, hence the MACD does the same.
The EMA is a version of the MA in which the most recent prices from the tracked data points have more significance and weight. In other words, the EMA is putting an emphasis on the latest periods compared to the rest.
Setting the MACD Indicator
As mentioned, the MACD line subtracts the EMA 26 from the EMA 12. Nevertheless, on the TradingView chart, the periods can be adjusted based on the needs from the indicator’s settings as shown in the example below (1 and 2):
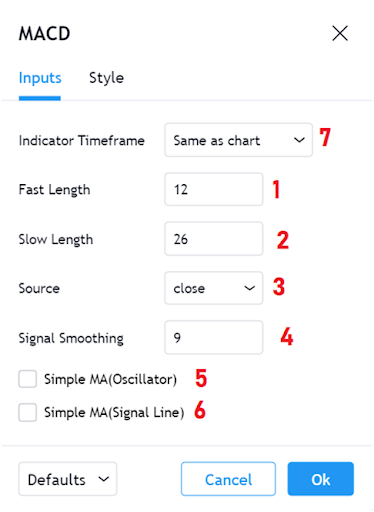

Besides this, you can also select the specific price data points, such as close, open, low, high, and more (3). The period for the signal line (EMA) can also be adjusted (4). If you want to use MAs instead of EMAs, you can replace those for both the MACD line and the signal line (5 and 6). Last but not least, you can set the indicator’s timeframe to the point where it might not necessarily coincide with the timeframe on the chart.
How to Use MACD for Crypto Trading
Now here is the most interesting part – we’re about to show you how to use the MACD. This indicator is like a Rubik’s Cube: it can be twisted in many ways. Here are the main approaches to implement the MACD in your trading strategies:
MACD Crossover
The most powerful signal of the MACD indicator happens when the MACD crosses the signal line in either direction. When the MACD crosses the signal line from bottom to top, traders interpret it as a bullish signal and open long positions. Conversely, when the MACD line turns south, crossing over the signal line and consolidating below it, traders either go short or close their bullish positions.

However, in order to avoid false signals, you can also watch the histogram, which should initially increase or decrease based on the current trend.
MACD Histogram
The indicator’s histogram can be used either independently or in combination with the signals provided by the crossovers of the two lines. In both cases, when the histogram crosses above its zero line and starts to rise gradually, we treat it as a bullish signal and vice versa. In fact, the histogram touches its zero line whenever the MACD and the signal line cross each other, as it represents the distance between the two. The fact that the histogram is rising confirms the uptrend. When it ceases to increase while being above the zero line, it’s time to close the long positions as the uptrend may be reversing.
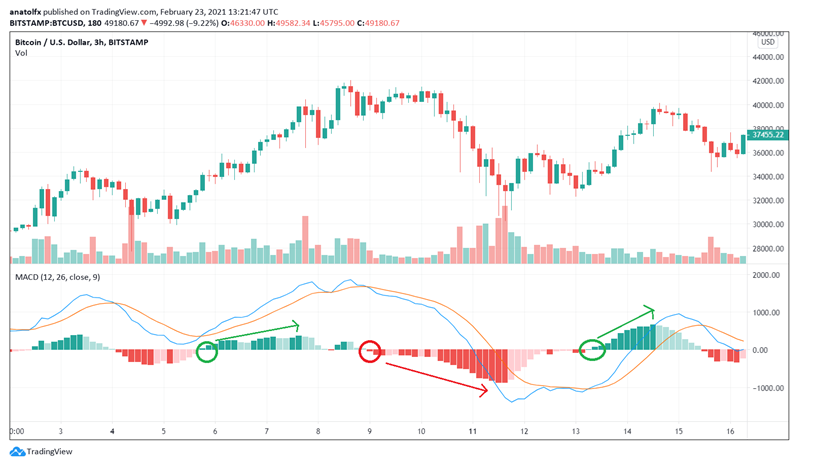

MACD Divergences
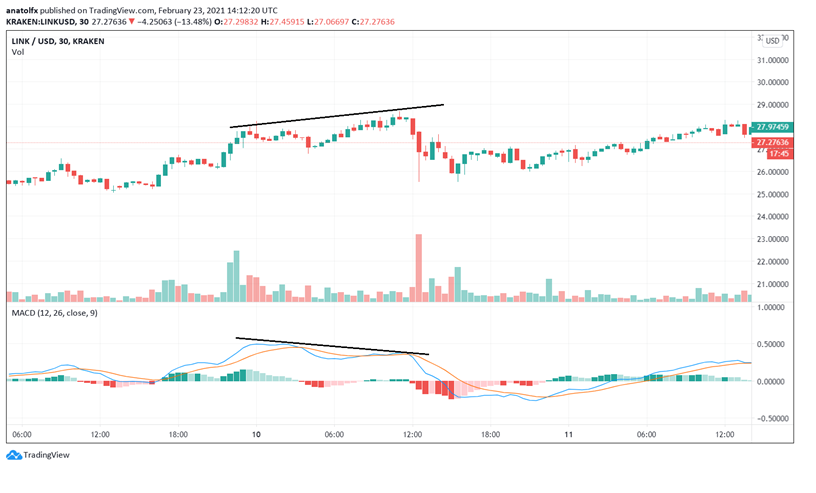
Besides the line crossovers and the insights from the histogram, the MACD indicator is also used to detect divergences between the price action and the MACD chart. For instance, if the price of Bitcoin or an altcoin forms a higher high while the MACD line displays a lower high, we get a bearish divergence. This scenario suggests that the bullish trend is weakening, and it’s time to get ready for a trend reversal. Usually, when this kind of divergence shows up, traders are opening short positions.
Elsewhere, if the MACD line forms a higher low at the same time when the price forms a lower low, we get a bullish divergence, meaning that the bearish trend has probably reached the oversold level and is about to reverse.
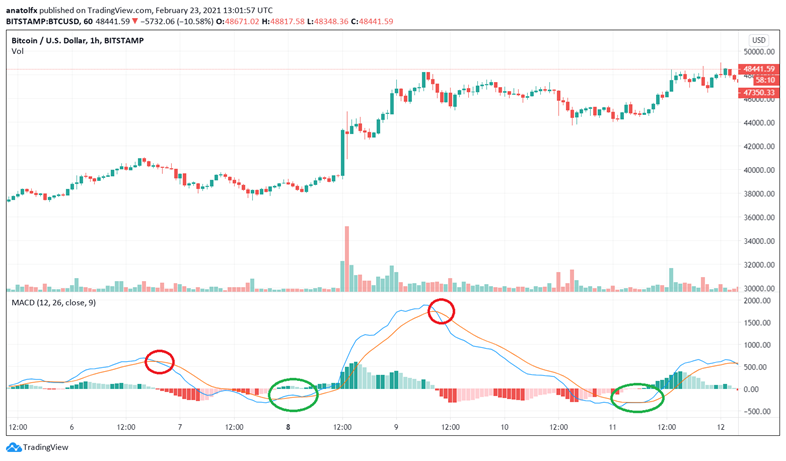
Here is an example of bearish divergence:

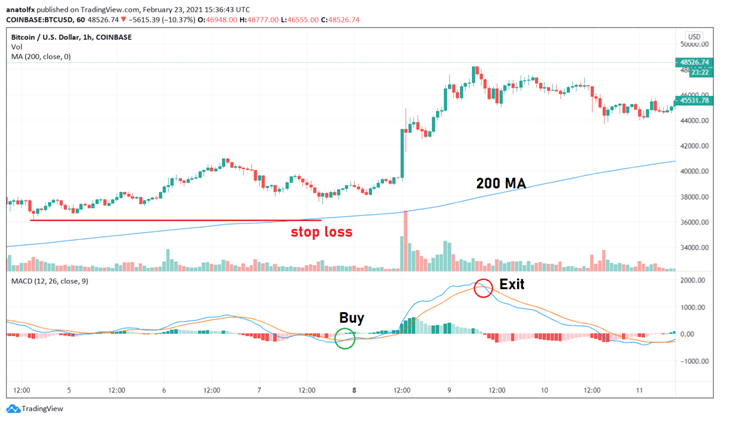
MACD Strategy Example
Experienced traders can use their creativity to come up with customized strategies based on the MACD indicator. Nevertheless, here is a basic example that beginners may consider. Here is what you need for this:
- MACD with default settings (EMA 12 and 16);
- 200 MA plotted on the price action.
- The strategy works on the following timeframes: M30, H1, H4, and D1.
Basically, the 200 MA is a slow moving average that uses the close prices of the last 200 periods (in our case, it’s about hours). According to our strategy, we’ll enter a long position when the price is above the 200 MA, and we’ll go short when the price is below the 200 MA.
Here are the main rules for going long:
- The price must fluctuate above the 200 MA;
- The MACD line must cross the signal line from bottom to top.
- You should place the Buy order during the candle that follows the crossover.
- The stop-loss should be set below the most recent support level.
- You should exit the market manually when the MACD line crosses the signal line from top to bottom, anticipating a trend reversal.
The rules for the short positions are the same but inverted:
- The price must be below the 200 MA;
- The MACD line must cross the signal line from top to bottom.
- You should place the Sell order during the candle that follows the crossover.
- The stop-loss should be set right above the most recent resistance level.
- You should exit the market manually when the MACD line crosses the signal line from bottom to top, anticipating a trend reversal.

Pros and Cons of MACD
Like any other technical analysis indicator, MACD has its advantages as well as limitations. Remember that there is no indicator out there that can guarantee winning trades all the time. Even if the signals are solid, the price might suddenly turn in any direction against all odds, especially on short-term charts. We’re speaking about cryptocurrencies, right? The market has matured to a certain degree, but it’s still very young compared to forex or stocks.
That being said, here are the main pros and cons of the MACD indicator:
MACD Strengths
The MACD indicator resonates with most cryptocurrency traders because it is quite simple to understand and reliable.
The great thing about the MACD is that it provides two kinds of signals: one that relates to the strength of the existing trend and another one determining the direction of the trend. Specifically, if the MACD line is looking upwards, we have a general uptrend. This aspect is important because, very often, the high volatility of cryptocurrencies makes it difficult to assess the direction of the general trend.
MACD Limitations
The MACD is not ideal. First of all, given that it relies on moving averages, the indicator is lagging, i.e. it provides its signals as the trend forms. After all, the calculations are based on the averages of historical prices. You cannot really count on the MACD indicator if you want to predict an upcoming trend.
Sometimes the MACD can provide false signals. For example, it may anticipate a trend reversal that never takes place. The opposite can also happen – the price is suddenly reversing even though the indicator pointing to the continuation of the trend.
What Other Technical Indicator Can I Combine with MACD?
The MACD can be mixed both with trend-following indicators and momentum indicators. Still, the most popular combination is the pair consisting of the MACD and the RSI. The duo is used to determine the overbought and oversold conditions of the market. The RSI provides such signals on its own, but the MACD improves their accuracy by a margin.
For those unfamiliar, when the price reaches the overbought level, it means that the bulls may be losing steam and the existing uptrend is about to reverse soon. Conversely, if the price reaches the oversold level, the current bearish trend may be oversaturated.
As a rule, when the MACD increases or drops rapidly, it suggests that the cryptocurrency is overbought or oversold, respectively. This situation usually anticipates a trend reversal. Traders would combine this MACD signal with the insights from the RSI. Other oscillators, such as Stochastic, can also do the trick.
Conclusion
The MACD is generally a reliable indicator, but you should start by testing it on a demo account or at least by analyzing the historical charts to detect past signals and see what percentage of them eventually materialized.
The volatility of cryptocurrencies can be misleading and cause the indicator to show unusual moves. The best way to limit losses is to use stop-loss orders and stick to the basic risk managing rules. The most important such rule is never to invest more than 1% per trade.
We hope that this short MACD guide will improve your trading profitability.